Vietnam’s unemployment rate was relatively stable in the late 1990s, around 2-3%, as economic reforms and foreign investments supported job growth. The early 2000s saw a further decrease to around 1.0% by 2011, reflecting a transition toward industrialization and job creation in manufacturing. In the 2010s, unemployment remained low due to continued economic growth and high workforce participation in informal sectors.
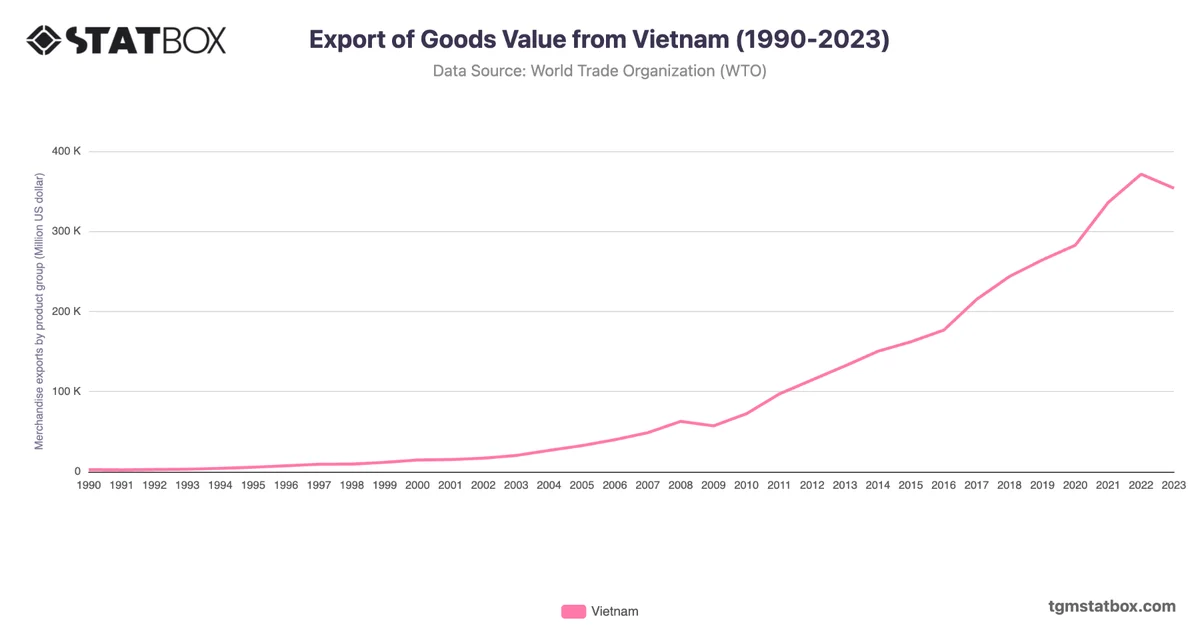
The rate increased slightly to 2.4% in 2021 due to COVID-19 but quickly recovered to 1.5% by 2022 as economic activity resumed. Low unemployment in Vietnam reflects the robustness of its labor market, bolstered by the expanding export-driven economy and resilient labor force.
The rate increased slightly to 2.4% in 2021 due to COVID-19 but quickly recovered to 1.5% by 2022 as economic activity resumed. Low unemployment in Vietnam reflects the robustness of its labor market, bolstered by the expanding export-driven economy and resilient labor force.
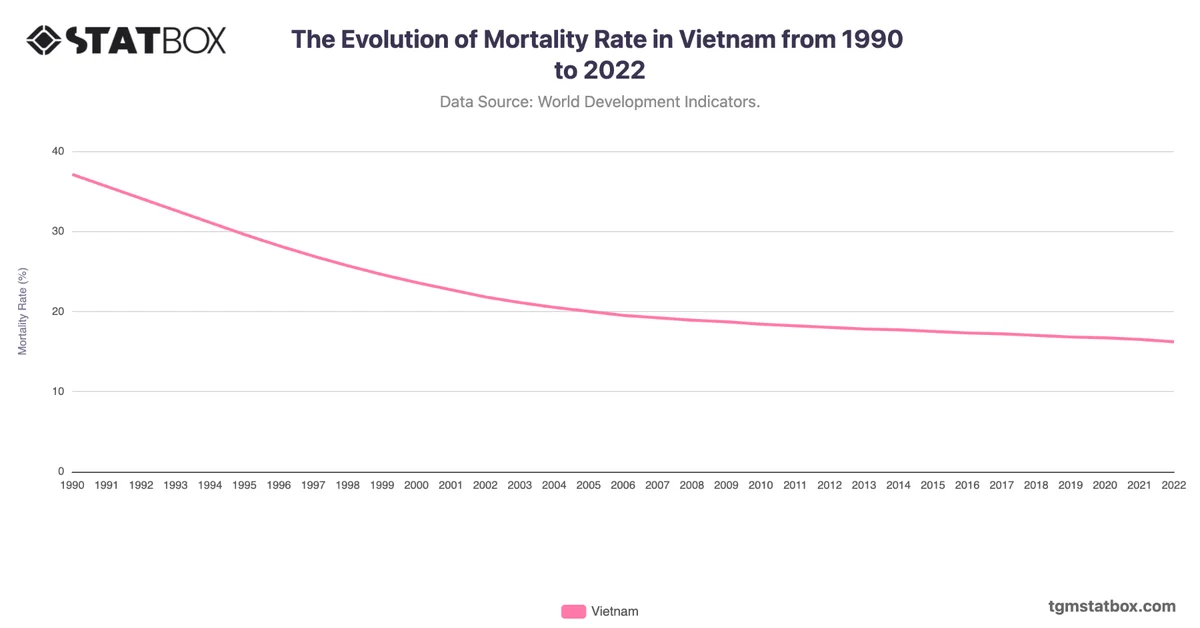
For additional information, visit statistics on Vietnam’s manufacturing sector share in GDP, Vietnam’s death rate shift, Vietnam’s services sector share in GDP.