Charts library
Not sure where to start? Dive into a diverse selection of charts and data visualizations across topics, and find the information you need to drive your research and analysis.
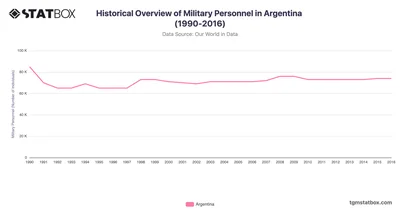
Argentina experienced a sharp decline in military personnel from 85,000 in 1990 to 65,000 by 1992. Discover more Argentina's statistics and insights on TGM StatBox.
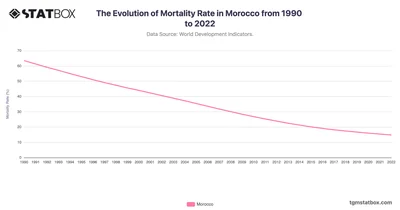
Morocco’s mortality rate fell from 63.5 in 1990 to 14.8 in 2022, highlighting healthcare advancements and public health reforms. Discover more insights on TGM StatBox.
 Pro
Pro
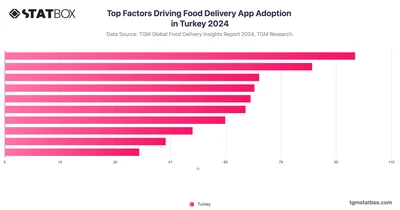
In Turkey, people use food delivery apps mainly for deals (31.7%), convenience during busy or sick days, and to save time or satisfy cravings.
 Pro
Pro
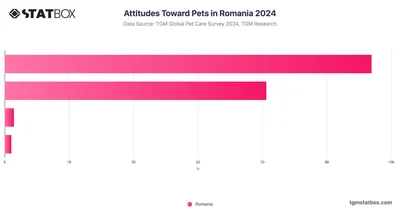
Romania shows a positive attitude towards pets. 56.93% of Romanians like all pets, while 40.6% prefer specific ones and only 1.03% are indifferent.
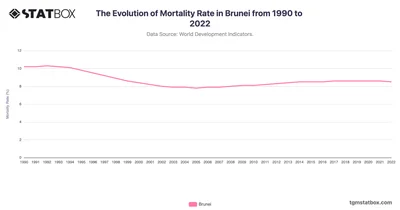
Brunei’s mortality rate remained stable, dropping from 10.2 in 1990 to 8.5 in 2022, reflecting consistent healthcare delivery. Discover more statistics and insights on TGM StatBox.
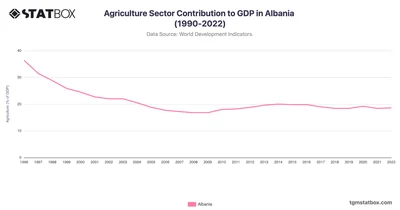
Albania’s agriculture GDP stabilizes post-transition, vital for rural employment. Discover Albania’s agriculture GDP data at TGM StatBox.
 Pro
Pro
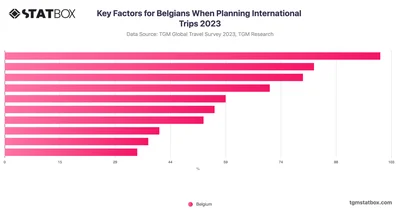
Belgian travelers place a high value on experiencing local culture and history, with 28% considering it a crucial factor in their travel planning.
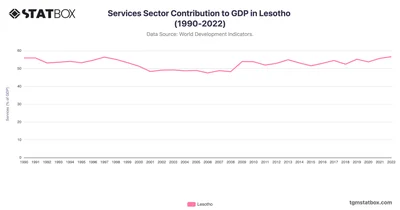
Lesotho’s services sector remained a significant GDP contributor, starting at 55.9% in 1990 and rising to 56.6% in 2022. Find more Lesotho’s GDP data on TGM StatBox.
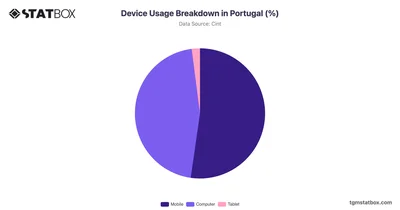
Explore device usage breakdown in Portugal, showcasing percentage distribution of smartphones, tablets, desktops. Analyze the trends shaping digital habits.
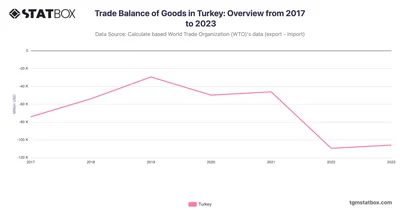
Turkey’s trade deficit remained high in 2023, driven by energy imports despite strong export performance. Discover more statistics and insights on TGM StatBox.
 Pro
Pro
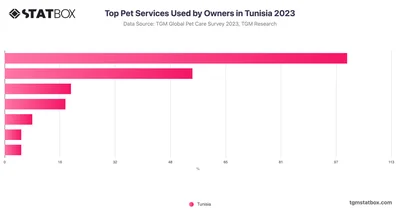
According to survey data, the most common utilized service among owners in Tunisia is veterinary care, with 62% of owners reporting usage.
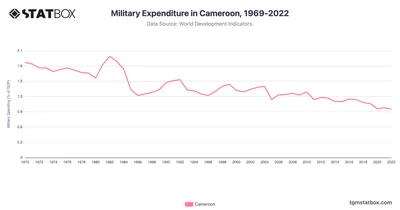
Cameroon's military expenditure dropped to 0.9% in 2022, prioritizing resilience. Explore more statistics and insights on TGM StatBox.
 Pro
Pro
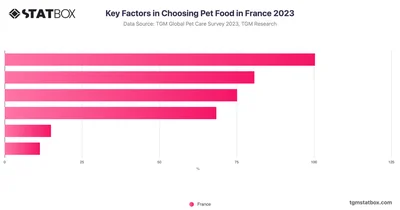
In France, quality is the top priority for 80.26% of respondents when selecting pet food, with price being the second most important factor.
 Pro
Pro
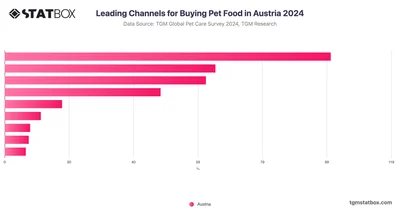
According to the data for Austria, the leading channels for buying pet food are supermarkets, with 50.6% of pet owners purchasing from this source.
 Pro
Pro
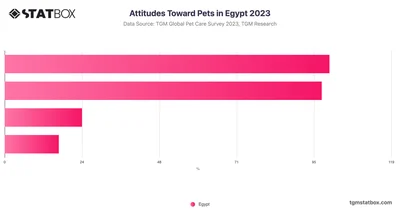
42% of Egyptian participants expressed a fondness for all pets, while 41% indicated a preference for specific types of pets, and 7% admitted to not liking pets.
 Pro
Pro
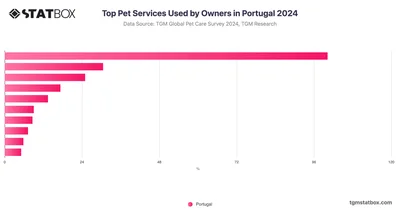
Veterinarian/Veterinary care is the most utilized pet service in Portugal, with an impressive 83.51% of pet owners relying on it.
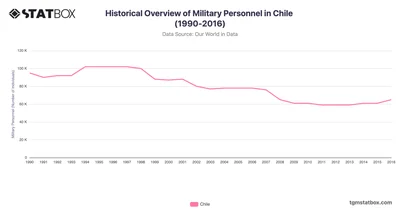
Chile’s military personnel levels saw notable fluctuations, driven by post-dictatorship reforms and modernization. Discover more statistics and insights on TGM StatBox.
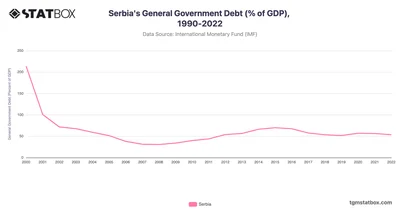
Serbia's general government debt as a percentage of GDP experienced a dramatic decline from 2000 to 2007. Discover more statistics on TGM StatBox.
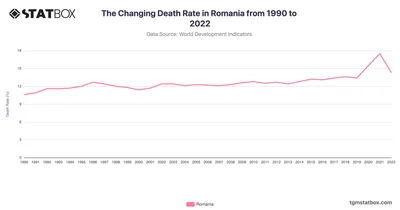
Romania’s death rate evolution highlights public health reforms and demographic changes. Discover more statistics and insights on TGM StatBox.
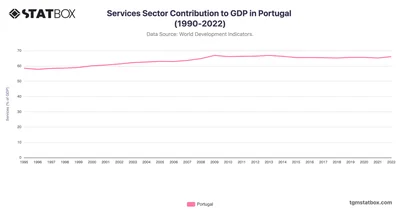
Portugal's services sector steadily expanded its GDP share from the mid-1990s, growing from 58.5% in 1995 to 64.8% by 2008. Find more data on TGM StatBox.
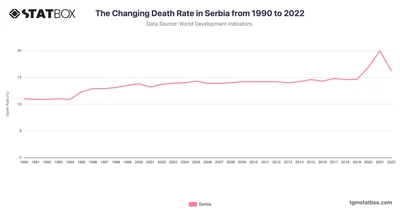
Serbia’s death rate trends highlight healthcare improvements amid demographic challenges. Discover more statistics and insights on TGM StatBox.
 Pro
Pro
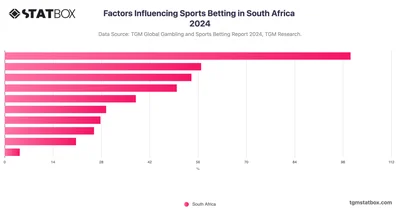
Examine the key factors shaping sports betting in South Africa, from cultural influences to market trends, in this TGM Statbox chart.
 Pro
Pro
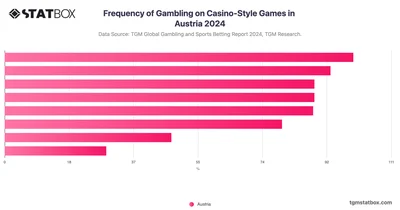
The most common gambling frequency in Austria is once a month (16.23%), while daily gambling is rare. Less frequent gambling remains significant overall.
 Pro
Pro
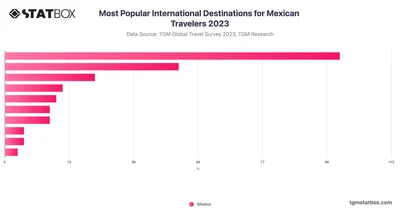
Mexican travelers prioritize North America, with 52% planning trips there, while 27% favor Central and South America, reflecting cultural ties and geographical proximity.
 Pro
Pro
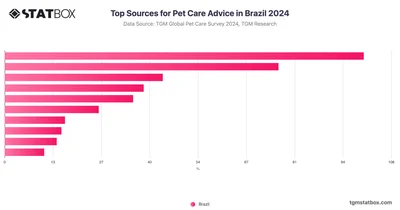
Internet searches are the second most popular source, with 56.66% of Brazilian pet owners turning to online resources for information.
 Pro
Pro
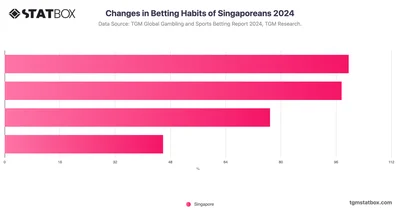
Track changes in betting habits among Singaporeans, highlighting shifts in preferences and activities over time with this TGM Statbox chart.
 Pro
Pro
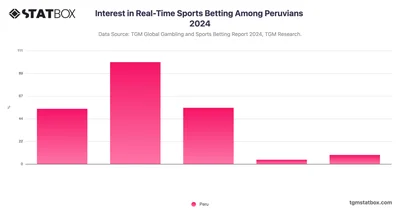
Interest in Real-Time Sports Betting Among Peruvians | TGM Statbox Chart: Discover Peruvians' interest in real-time sports betting with TGM Statbox's informative chart.
 Pro
Pro
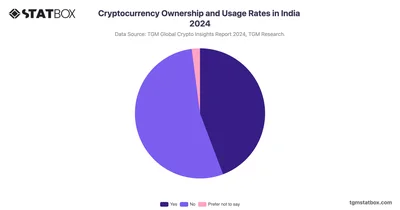
With 44% of respondents having owned or used cryptocurrency, there is a solid base of active users, indicating growing interest in digital currencies.
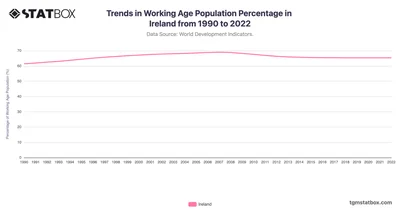
After 2008, Ireland's working-age population began to decline, stabilizing at 65.3% from 2020 onwards. Discover the complete Ireland's data on TGM StatBox.
 Pro
Pro
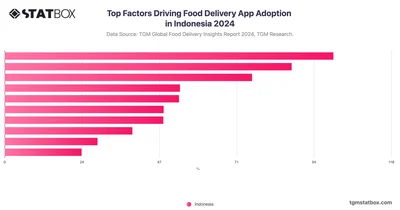
In Indonesia, food delivery use is driven by deals (42.5%), time-saving, and convenience. Safety and health also matter, but value is the top priority for most users.






