Share the statistic on social media channels or embed the statistic in your website using "Embed Code", where available.
Share chart
Embed chart Embed copied!Cite this statistic and select one of the following formats: APA, Chicago, Harvard, MLA & Bluebook
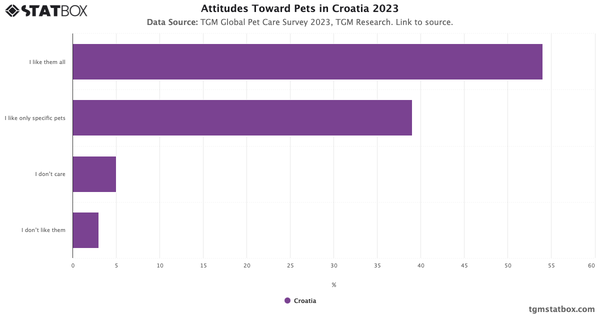
TGM Global Pet Care Survey 2023, TGM Research
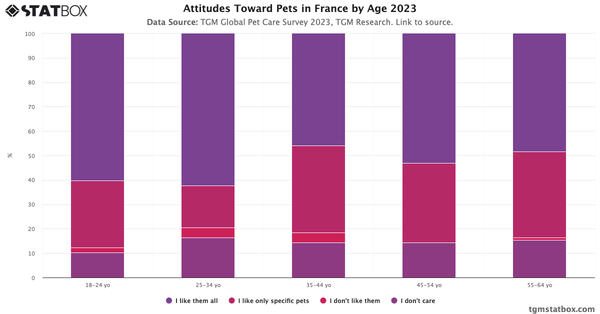
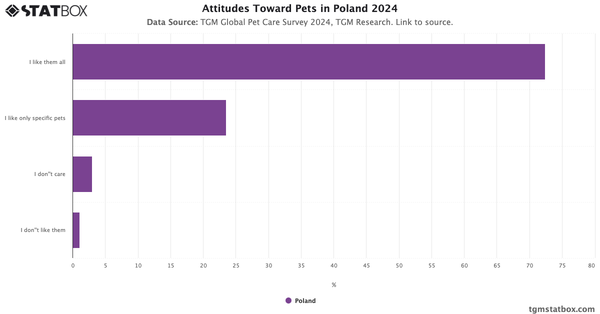
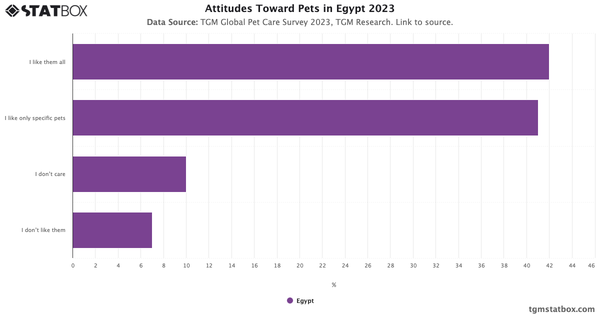
"What is your attitude towards pets?"
Key Takeaways
46% of Canadians express a fondness for all pets, while 38% prefer specific animals. A small minority, about 5%, indicates they do not like pets at all. 11% of Canadians claim indifference towards pets.
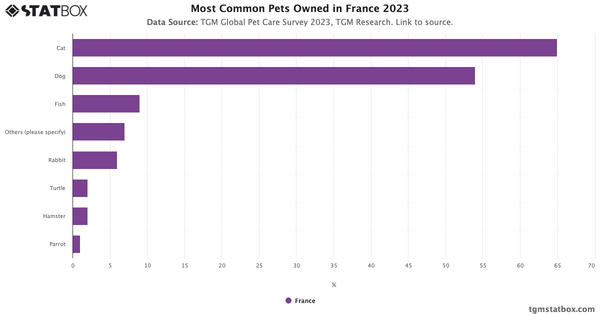
For a broader context, visit other statistics on most popular pets in Canada, motivations for choosing pet food in Canada, most popular pet services in Canada.

Pet Care Report in Canada 2023
Learn more about Pet Care in Canada with TGM StatBox. Explore our detailed report, complete with graphs and tables, for in-depth insights.
Go to report


Connect with our expert team for immediate assistance or comprehensive market analysis. We are always ready to support your business needs.