Device Usage Breakdown in Australia (%)

Device Usage Breakdown in Australia (%)

Share the statistic on social media channels or embed the statistic in your website using "Embed Code", where available.

Share chart

Embed chart
Select Citation

Cite this statistic and select one of the following formats: APA, Chicago, Harvard, MLA & Bluebook


  • APA
  • Chicago
  • Harvard
  • MLA
  • Bluebook
  • IEEE
TGM StatBox. (2024). Device Usage Breakdown in Australia (%). TGM StatBox.
Chart Details
Data Source: Cint
Timeframe: 2022
Country: Australia
Published date: 2024
Survey Question: Data is based on traffic from Apr-22 to Jun-22.
Key Takeaways
In Australia, the distribution of device usage reflects a technological maturity, with 46.52% using mobile devices and 50.33% opting for computers. This balance indicates a robust infrastructure supporting both mobile and desktop platforms, catering to different user needs, from casual browsing to professional tasks. The prevalence of computers highlights the importance of a connected workforce in a developed economy.

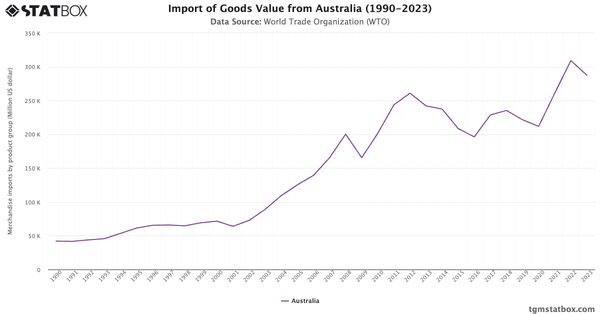
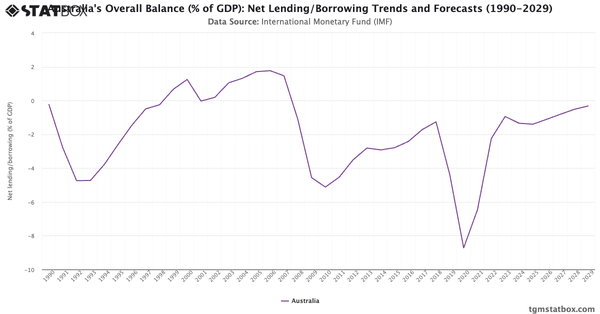
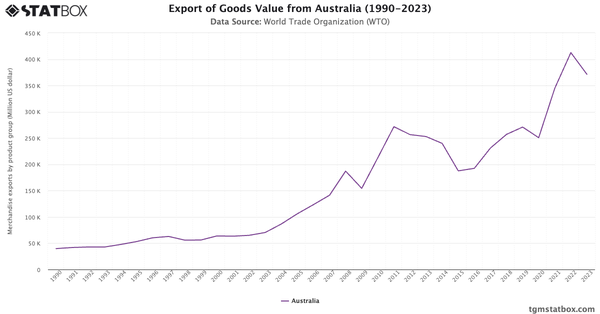
For a broader context, visit other statistics on Australia’s urban population growth, Australia’s net lending/borrowing ratio, Australia’s goods export value.

Would you like to know more?
Check our report on this topic

Sustainability Report: Insights in Australia

Australia Sustainability Insights Report 2024

Sustainability Report: Insights in Australia

Learn more about sustainability insights in Australia with TGM StatBox. Explore in-depth insight report, featuring user behavior, trends, and preferences.

Go to report

Further Recommended Statistics

Statbox vector
Statbox |form contact icon

Have Other Queries?

Statbox vector

Connect with our expert team for immediate assistance or comprehensive market analysis. We are always ready to support your business needs.