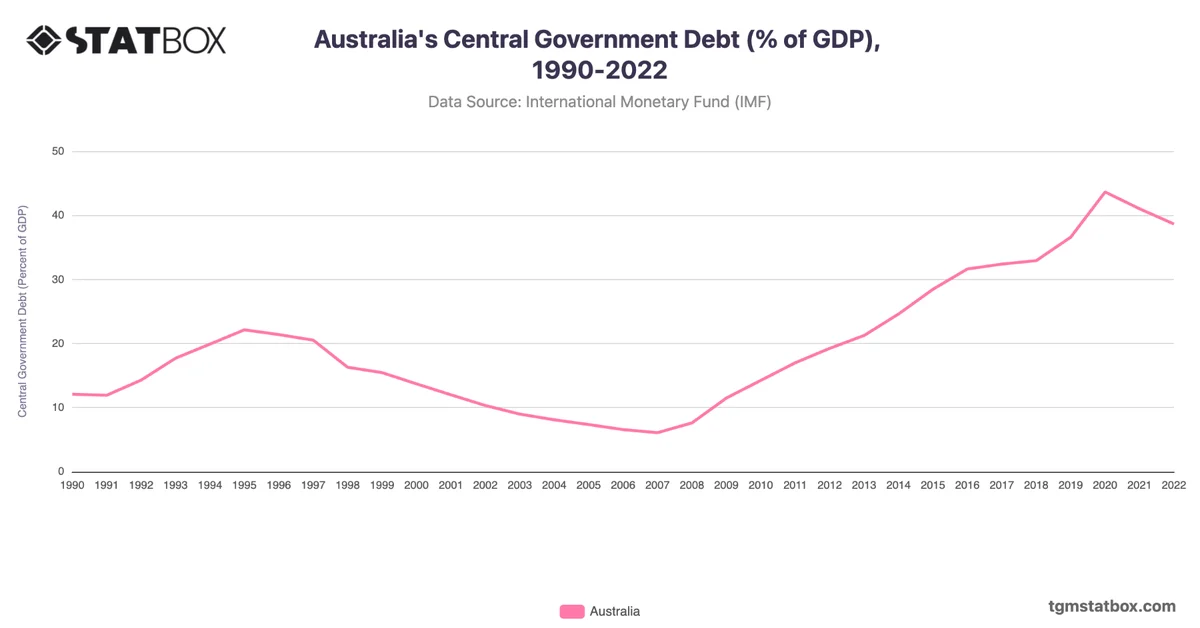
Australia’s general government debt fluctuated modestly through the 1990s, peaking at 31.7% in 1994 before entering a period of consistent decline, reaching a low of 9.7% by 2007. This decline reflected Australia’s strong economic growth, which allowed it to achieve budget surpluses and reduce debt levels significantly. However, following the 2008 global financial crisis, debt levels began to rise as the government implemented stimulus measures, with debt increasing to 24% of GDP by 2011.
The debt-to-GDP ratio continued to grow in subsequent years, with Australia’s debt reaching 46.7% by 2019 as public spending increased to address infrastructure needs and economic challenges. The COVID-19 pandemic significantly impacted Australia’s debt, which peaked at 57.6% in 2021 due to increased government spending on economic relief measures. By 2022, debt slightly decreased to 55.7% as economic recovery measures continued.
The debt-to-GDP ratio continued to grow in subsequent years, with Australia’s debt reaching 46.7% by 2019 as public spending increased to address infrastructure needs and economic challenges. The COVID-19 pandemic significantly impacted Australia’s debt, which peaked at 57.6% in 2021 due to increased government spending on economic relief measures. By 2022, debt slightly decreased to 55.7% as economic recovery measures continued.
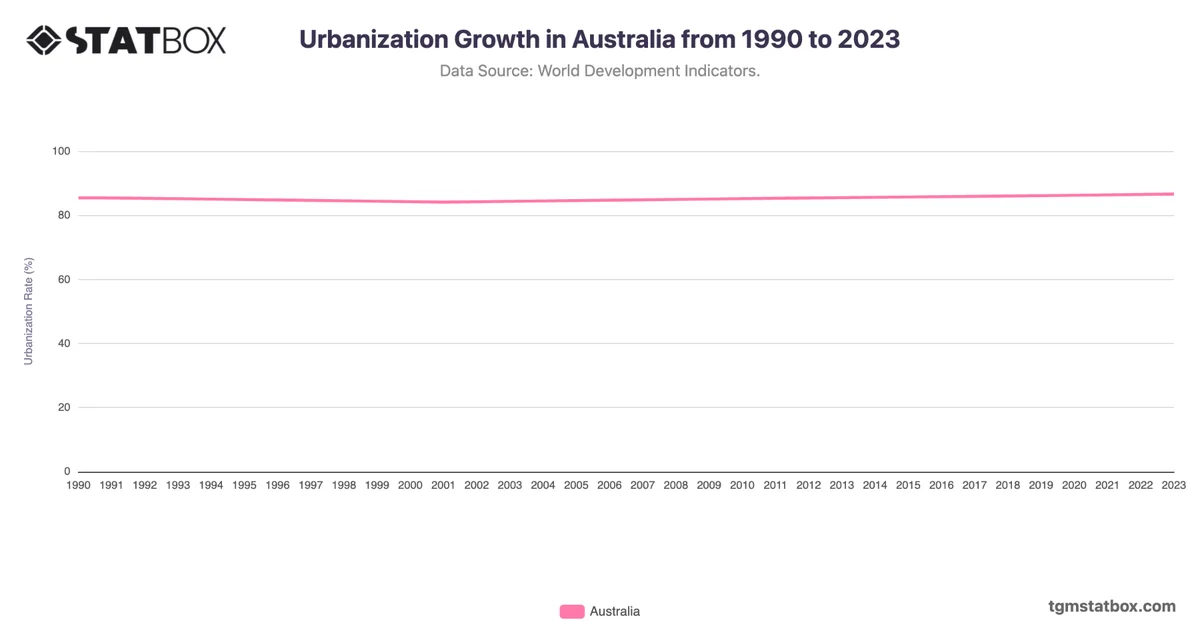
For a deeper dive into the topic, explore Australia’s urban population growth, Australia’s goods export value, Australia’s net lending/borrowing ratio.