Australia's net lending/borrowing trends demonstrate resilience despite periodic challenges. The 1990s saw gradual fiscal improvement, culminating in surpluses by 1999-2007, supported by robust economic growth. However, the 2008 financial crisis and subsequent stimulus measures caused deficits to peak at -5.1% in 2010.
The pandemic led to a significant fiscal strain, with the deficit widening to -8.7% in 2020. Recovery has been steady, with the balance expected to improve to -0.3% by 2029. This reflects Australia's strong economic fundamentals and prudent fiscal management, even in the face of global uncertainties.
The pandemic led to a significant fiscal strain, with the deficit widening to -8.7% in 2020. Recovery has been steady, with the balance expected to improve to -0.3% by 2029. This reflects Australia's strong economic fundamentals and prudent fiscal management, even in the face of global uncertainties.
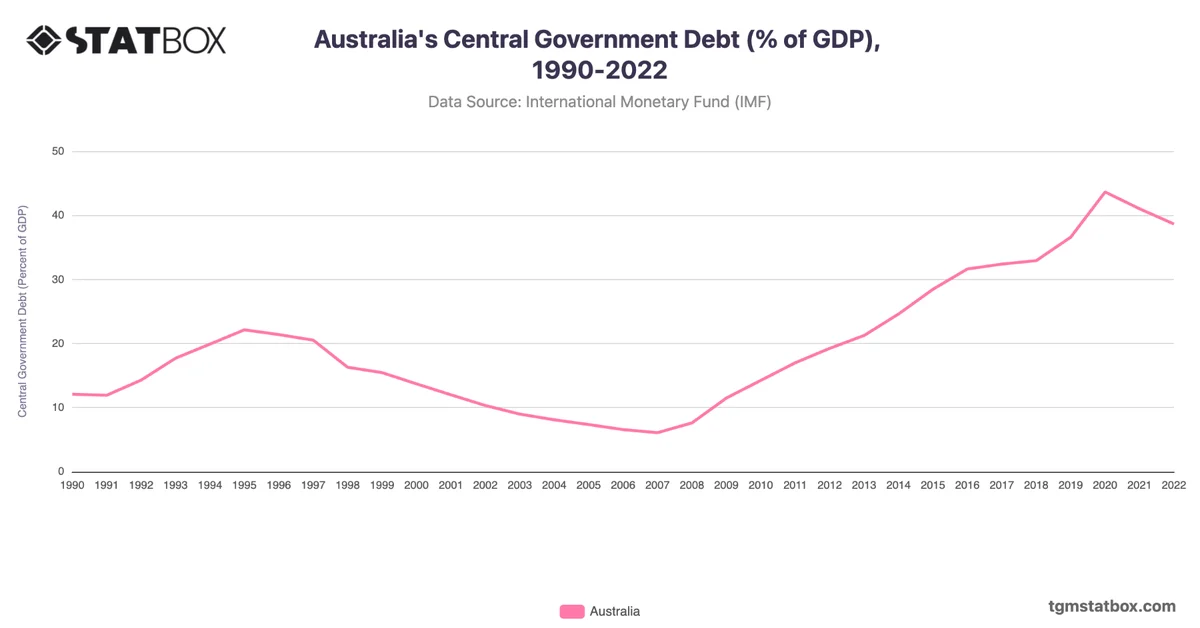
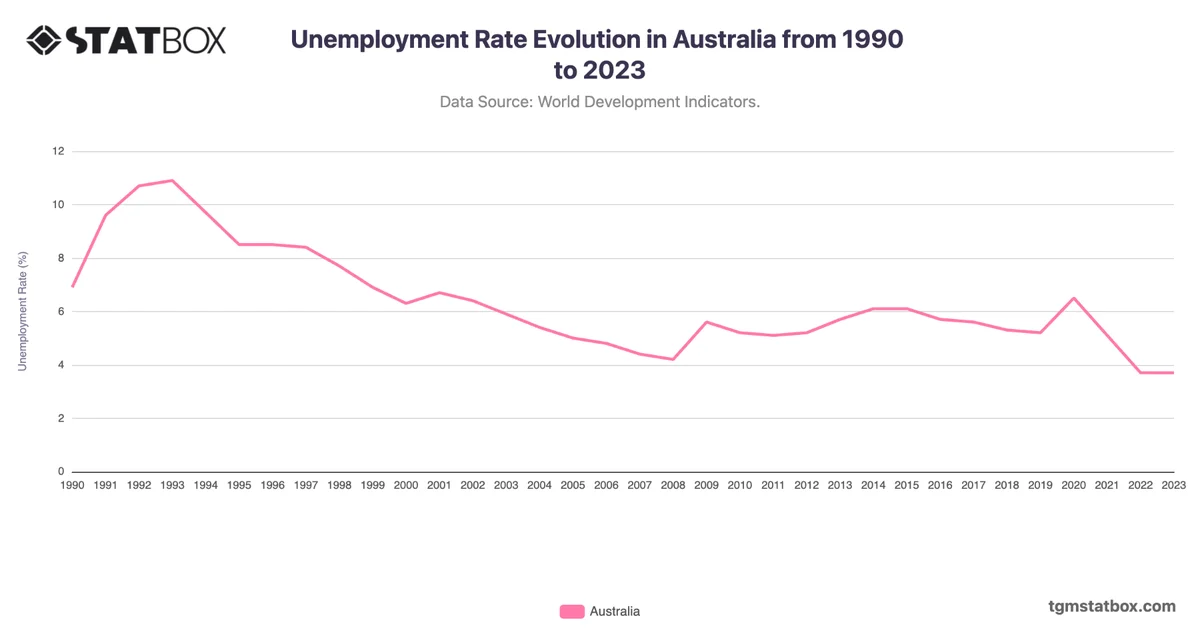
For a broader context, visit other statistics on Australia’s unemployment rate evolution, Australia’s population growth trend, Australia’s government debt as a percentage of GDP.