Australia's fertility rate exhibited a relatively stable trend from 1990 to 2022, fluctuating between 1.6 and 2.0 births per woman. Notable peaks occurred in 2007-2009 when the rate reached 2.0, likely influenced by economic stability and policies such as the "baby bonus" incentives introduced during this period. However, from 2010 onwards, the fertility rate saw a gradual decline, stabilizing at 1.6 in 2020 and 2022, reflecting shifting societal norms and delayed parenthood trends.
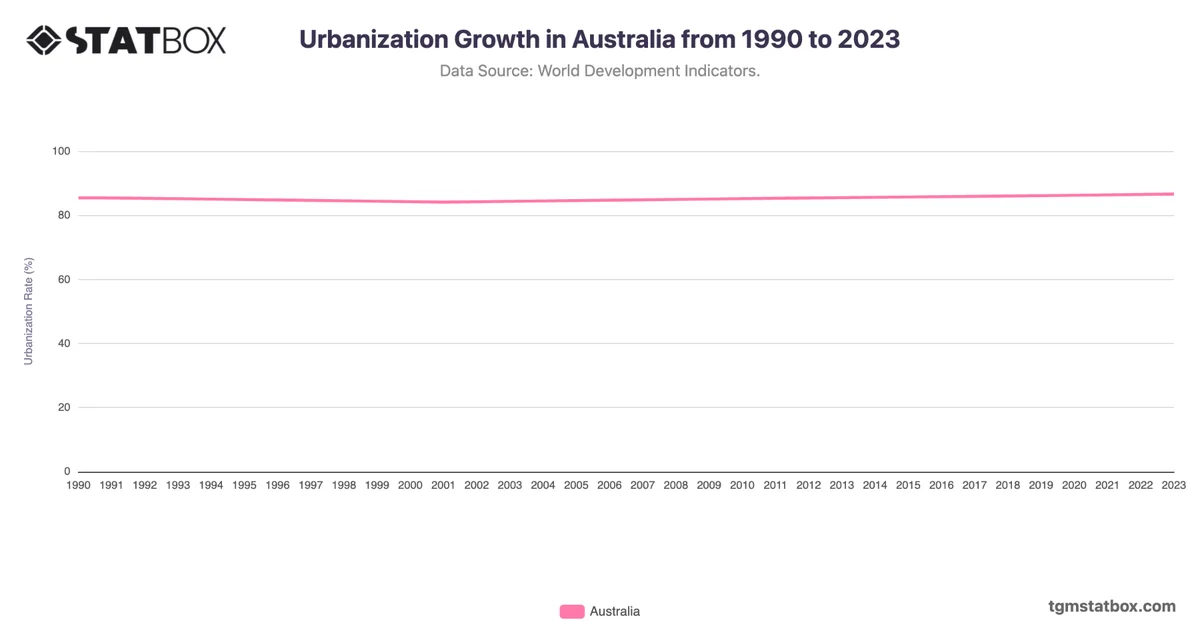
The consistent levels before 2007 reflect Australia's robust healthcare and education systems, ensuring family planning awareness. However, the decline in recent years aligns with global patterns of urbanization and increased costs of living, which have led many couples to opt for smaller families. Immigration played a key role in offsetting the slower population growth attributed to lower fertility rates.
The consistent levels before 2007 reflect Australia's robust healthcare and education systems, ensuring family planning awareness. However, the decline in recent years aligns with global patterns of urbanization and increased costs of living, which have led many couples to opt for smaller families. Immigration played a key role in offsetting the slower population growth attributed to lower fertility rates.
Discover additional trends and data on Australia’s working-age population ratio, Australia’s annual GDP growth rate, Australia’s urban population growth.