Ethiopia's fiscal trends highlight a mix of economic challenges and progress. The early 1990s saw significant deficits averaging -5.8%, driven by post-conflict reconstruction and limited fiscal capacity. By the late 1990s, deficits worsened, reaching -8.9% in 2000 during a period of border conflict and increased military spending.
Improvements in governance and economic reforms in the 2000s led to more manageable deficits, with levels stabilizing below -3% by the mid-2010s. However, external shocks, including the COVID-19 pandemic, saw deficits rise to -4.2% in 2022. Projections for 2029 indicate stabilization around -2.7%, reflecting fiscal consolidation efforts and ongoing economic growth initiatives.
Improvements in governance and economic reforms in the 2000s led to more manageable deficits, with levels stabilizing below -3% by the mid-2010s. However, external shocks, including the COVID-19 pandemic, saw deficits rise to -4.2% in 2022. Projections for 2029 indicate stabilization around -2.7%, reflecting fiscal consolidation efforts and ongoing economic growth initiatives.
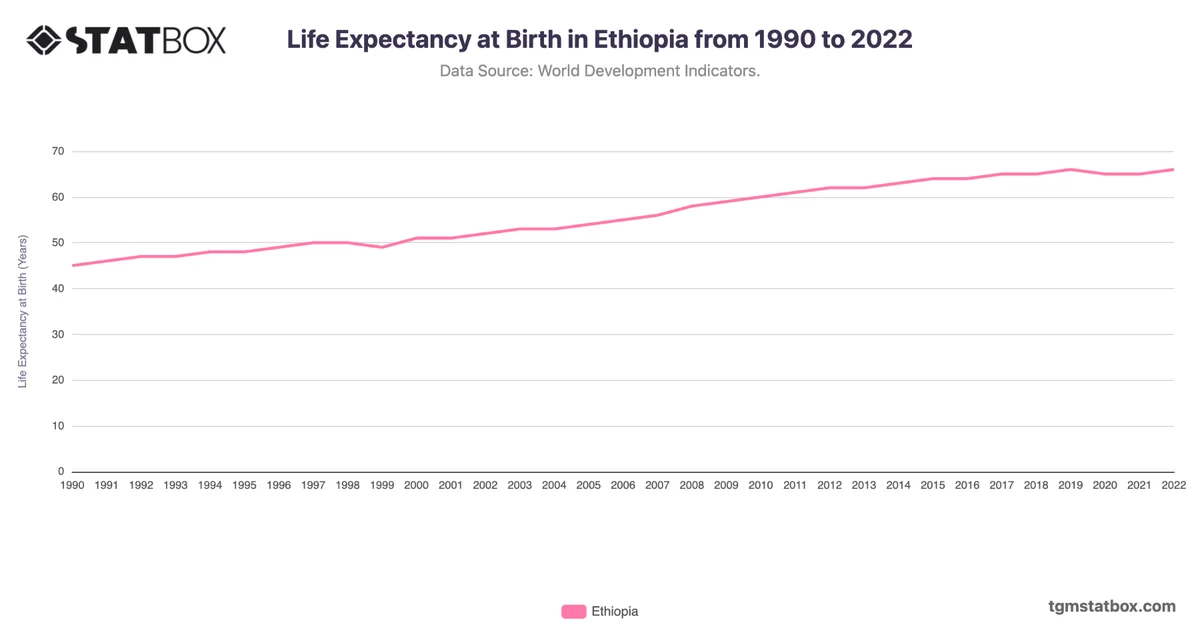
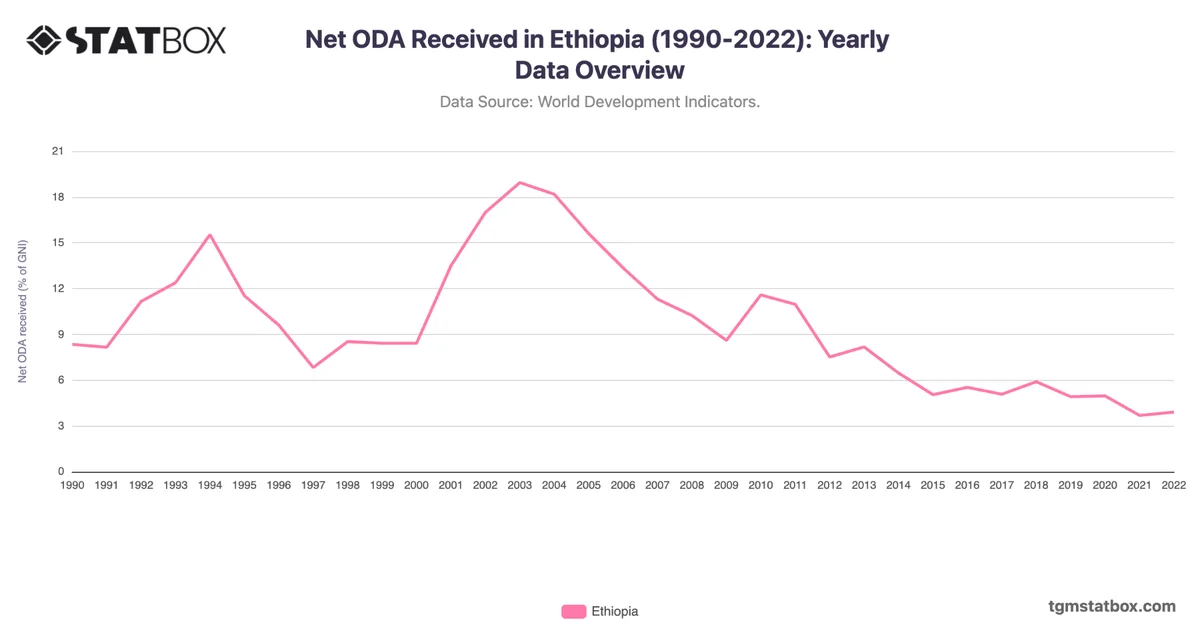
Explore related charts to gain a better understanding of Ethiopia’s military spending, Ethiopia’s yearly net ODA received, Ethiopia’s mortality shift.