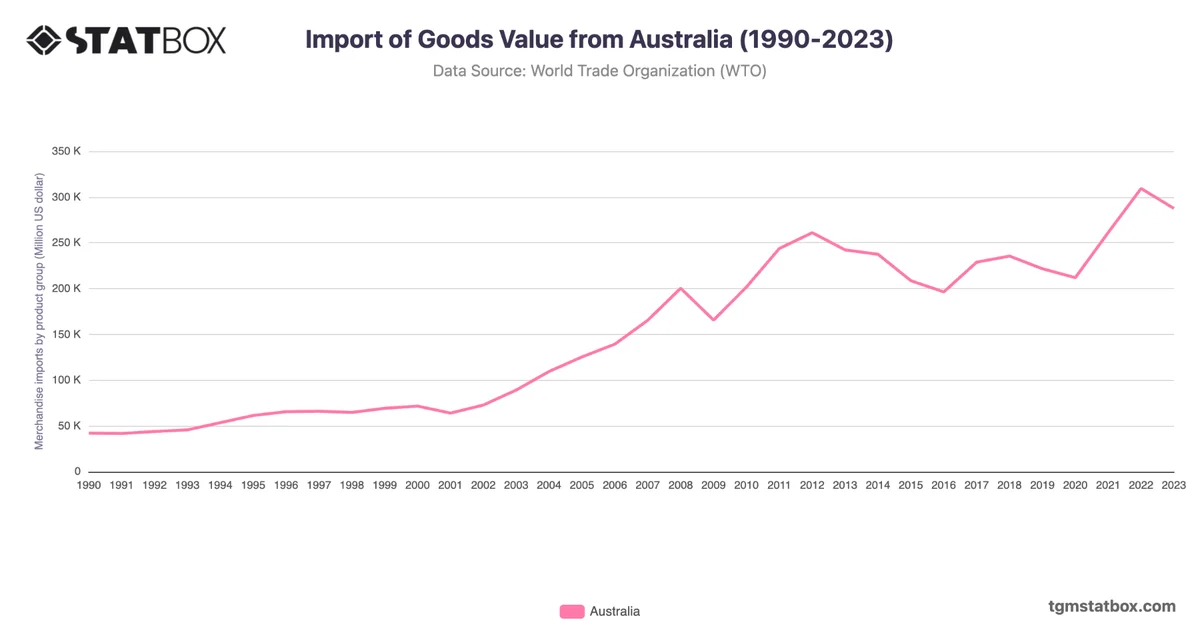
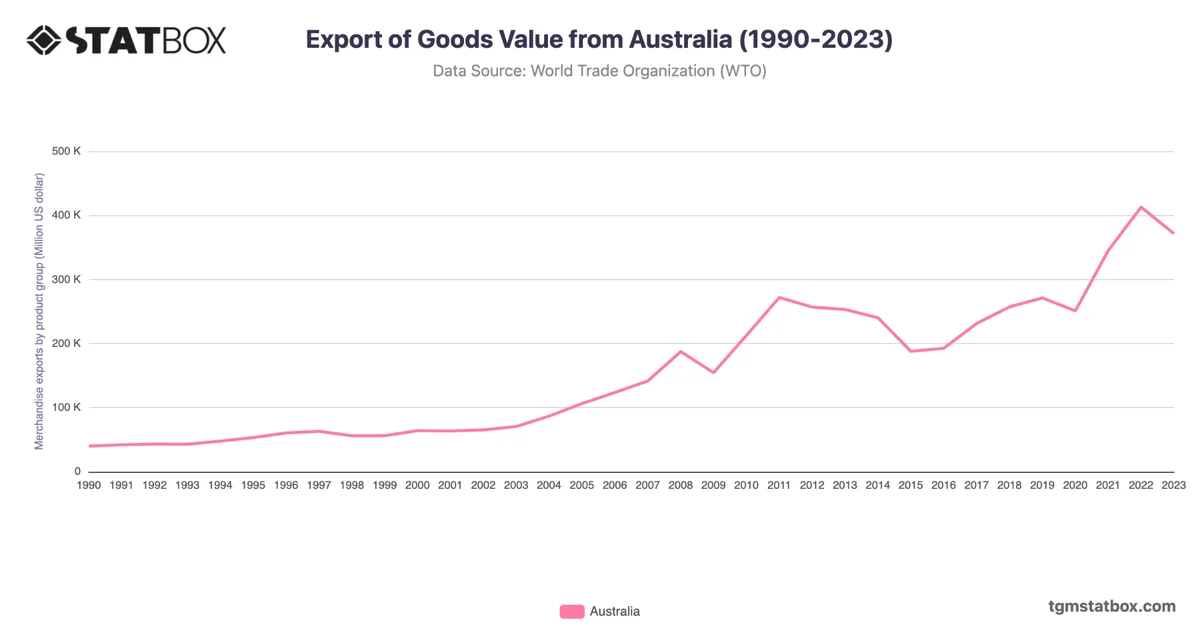
Australia’s trade balance of goods grew significantly over the 2017–2023 period, shifting from 2,351.2 million USD in 2017 to an impressive 103,494.3 million USD in 2022 before moderating slightly to 83,126.2 million USD in 2023. This upward trajectory reflects booming exports of natural resources such as iron ore, coal, and liquefied natural gas, driven by strong demand from key trading partners like China and India.
The decline in 2023 compared to the previous year may be linked to softening global commodity prices and geopolitical uncertainties. Nonetheless, Australia’s trade surplus underscores the economy's strength in resource-based exports, even as efforts to diversify its trade portfolio continue.
The decline in 2023 compared to the previous year may be linked to softening global commodity prices and geopolitical uncertainties. Nonetheless, Australia’s trade surplus underscores the economy's strength in resource-based exports, even as efforts to diversify its trade portfolio continue.
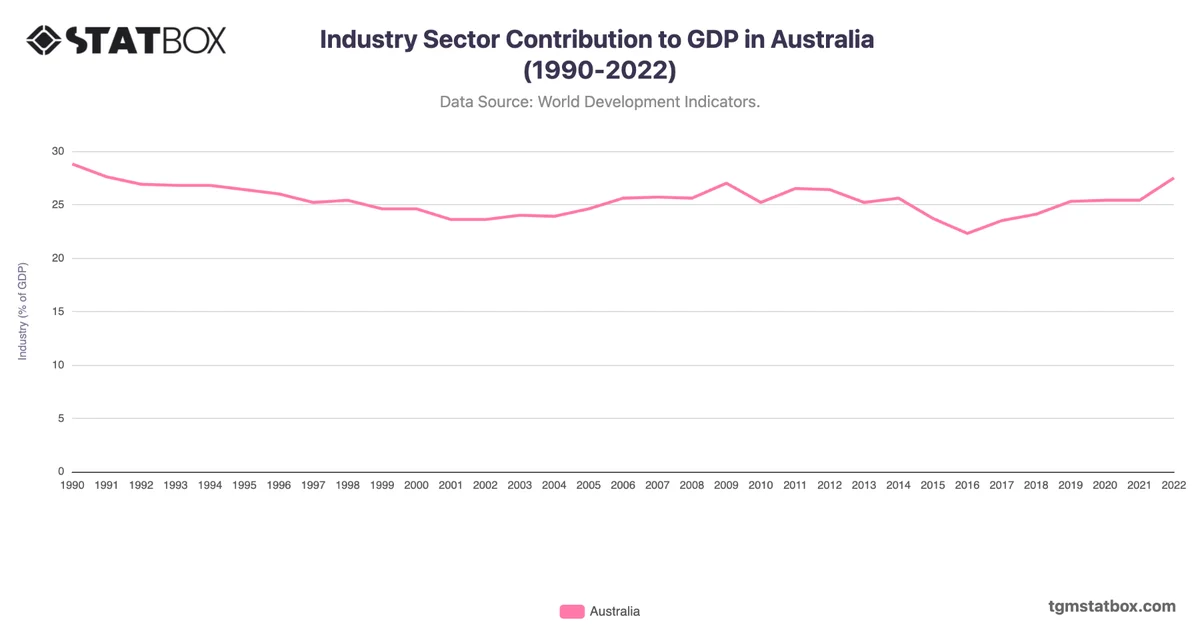
Find out more through related statistics on Australia’s population growth trend, Australia’s industry sector’s GDP share, Australia’s agriculture sector GDP share.