Chart

Life Expectancy at Birth in Australia from 1990 to 2022

Life Expectancy at Birth in Australia from 1990 to 2022

Share the statistic on social media channels or embed the statistic in your website using "Embed Code", where available.

Share chart

Embed chart
Select Citation

Cite this statistic and select one of the following formats: APA, Chicago, Harvard, MLA & Bluebook


  • APA
  • Chicago
  • Harvard
  • MLA
  • Bluebook
  • IEEE
TGM StatBox. (2024). Life Expectancy at Birth in Australia from 1990 to 2022. TGM StatBox.
Insights

Key Takeaways

Australia achieved one of the highest global life expectancies, rising from 77 years in 1990 to 83 years by 2017 and maintaining this level through 2022. Strong healthcare policies, advancements in medical technology, and public health campaigns targeting chronic conditions such as heart disease and cancer contributed to this success. Australia's continued emphasis on health equity and preventive care ensured sustained gains over decades.

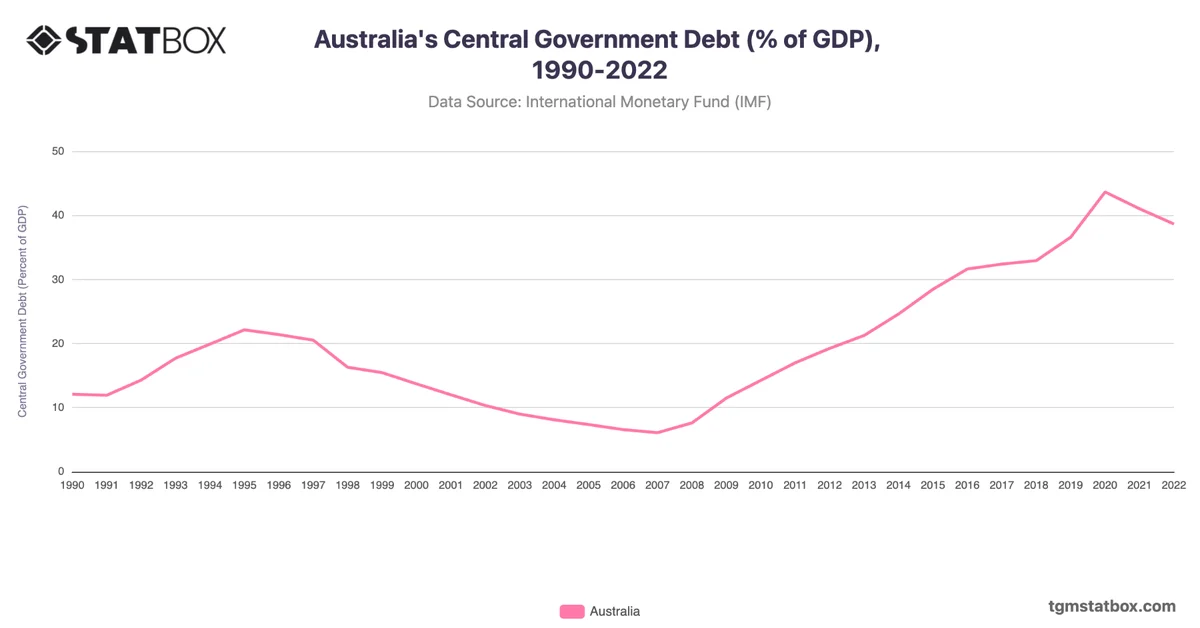
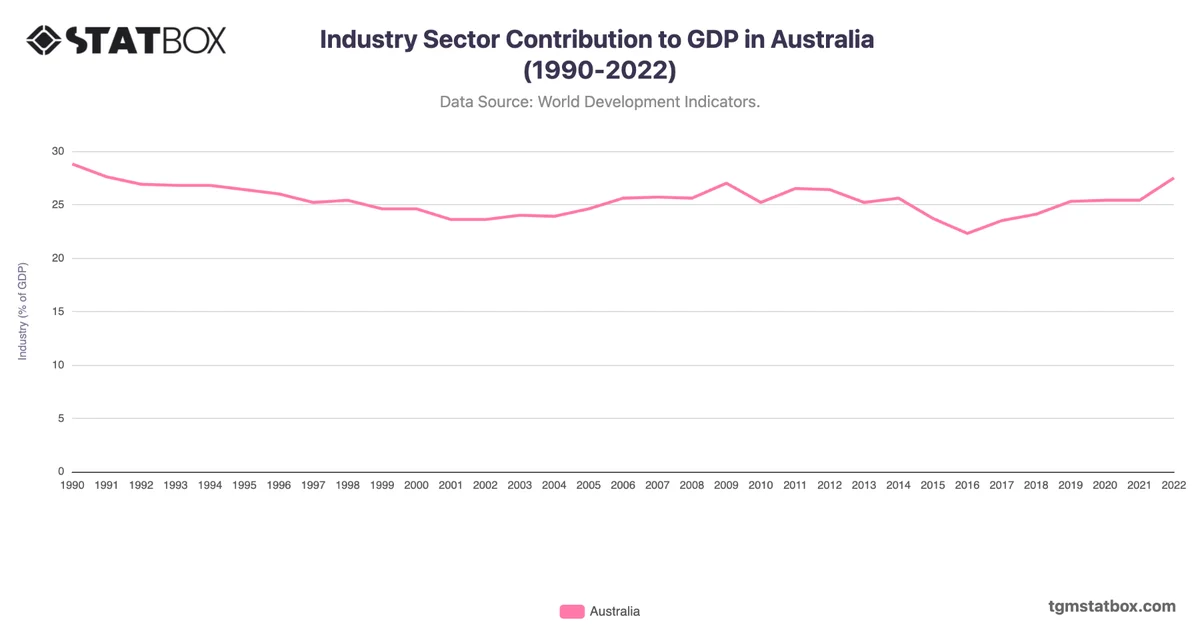
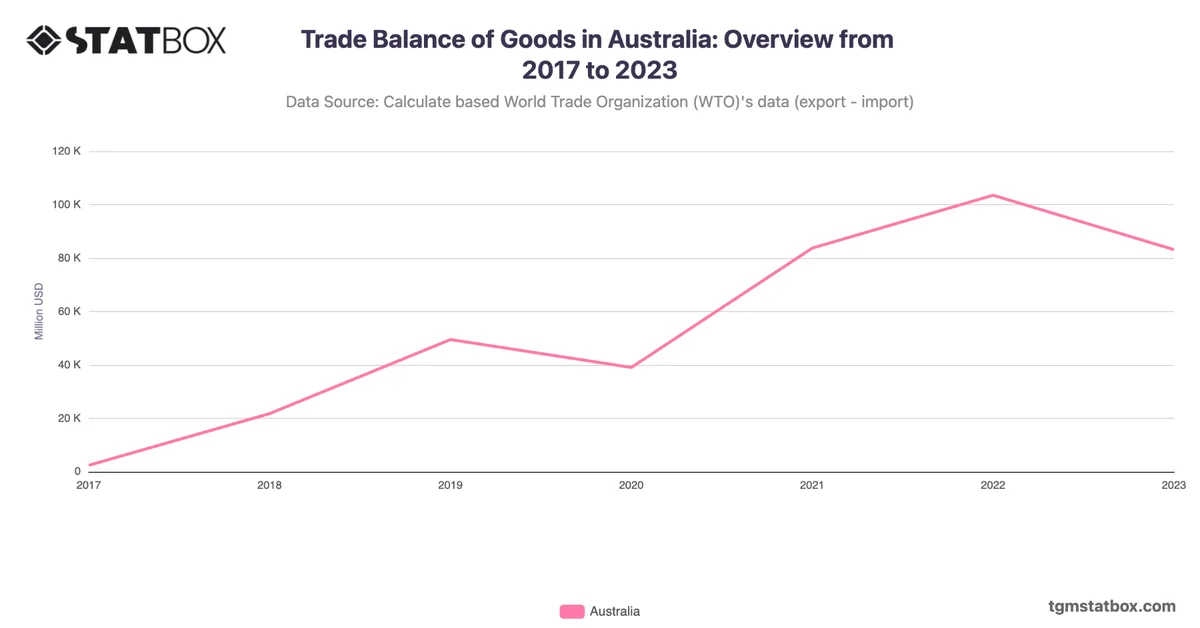
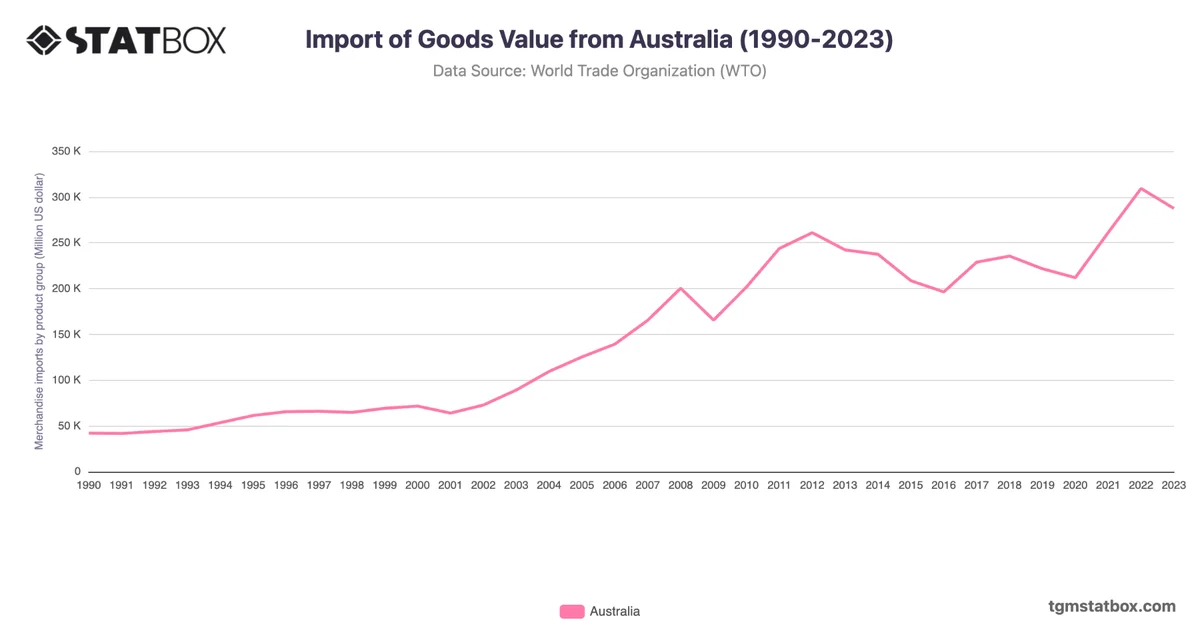
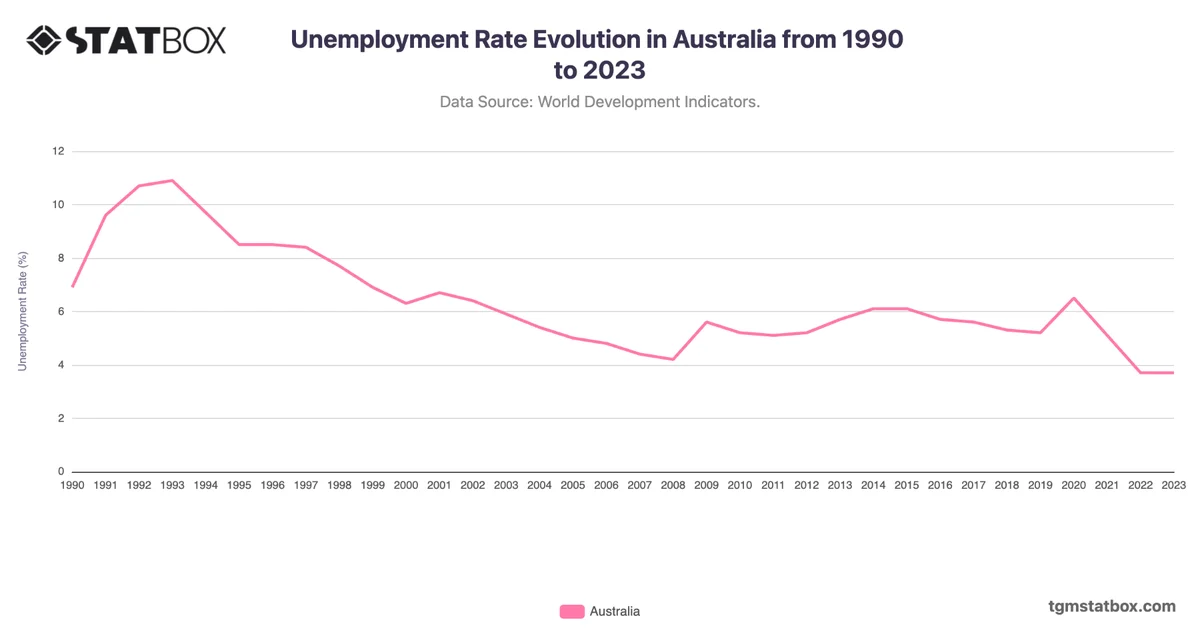
Explore related charts to gain a better understanding of Australia’s unemployment rate evolution, Australia’s annual GDP growth rate, Historical overview of military personnel in Australia.

AI-powered chart insight: This summary is automatically generated to help you understand the chart at a glance. It is intended as an overview; view the full chart and underlying data for complete context.

Related report

Would You Like to Know More?
Explore Our Australia Report

Charts library

Further Recommended Australia Statistics

Statbox vector
The briefing
New data, in your inbox

Consumer insights, data stories and product updates as we publish them. No other mail, and one click to leave.

Roughly two emails a month.

Research services
Have a question our newsroom hasn't answered? Ask it directly.

Our team can run the study behind the story — in 60+ countries, on your question, with the data belonging to you.