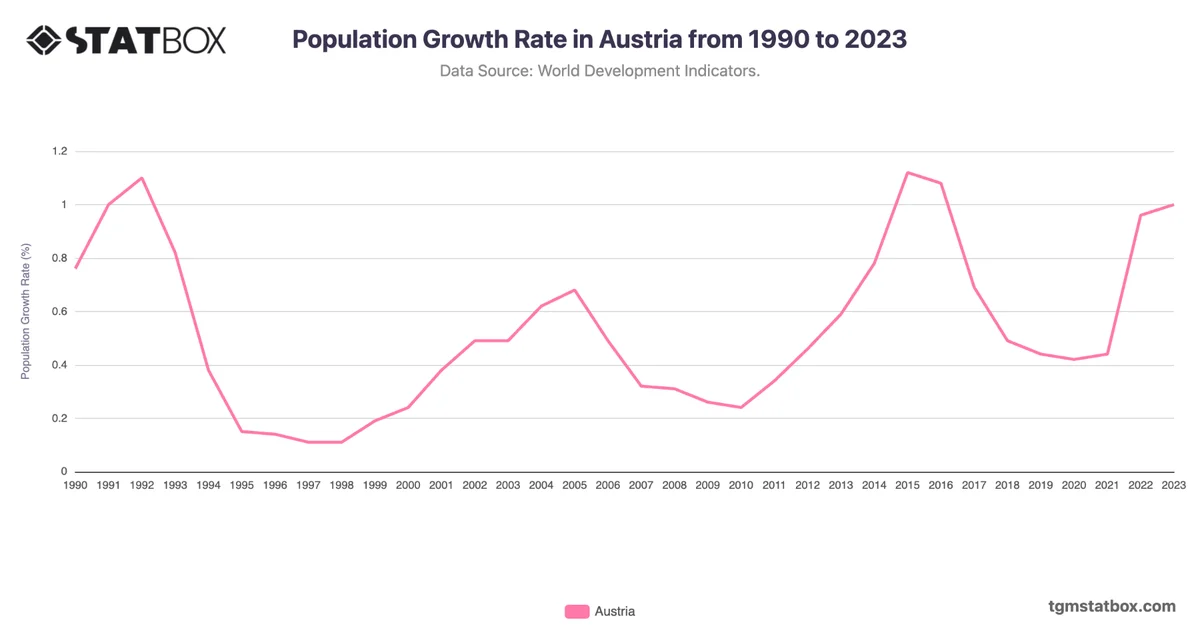
Austria's population density showed a consistent but moderate increase from 93 people per square kilometer in 1990 to 109 by 2021. The density increase was gradual, reflecting Austria’s steady population growth and stable immigration policies. By 2000, the density reached 97 and then slowly rose to 108 by 2019, paralleling urban development in cities like Vienna, where migration has contributed to growth.
The slight rise to 109 by 2021 reflects Austria’s aging population, mitigated by sustained levels of immigration. This consistent growth pattern underscores Austria’s balanced demographic and immigration policies, contributing to a steady but contained increase in population density.
The slight rise to 109 by 2021 reflects Austria’s aging population, mitigated by sustained levels of immigration. This consistent growth pattern underscores Austria’s balanced demographic and immigration policies, contributing to a steady but contained increase in population density.
For a broader context, visit other statistics on Austria’s urbanization trends, Austria’s population figures, Austria’s services sector GDP share.