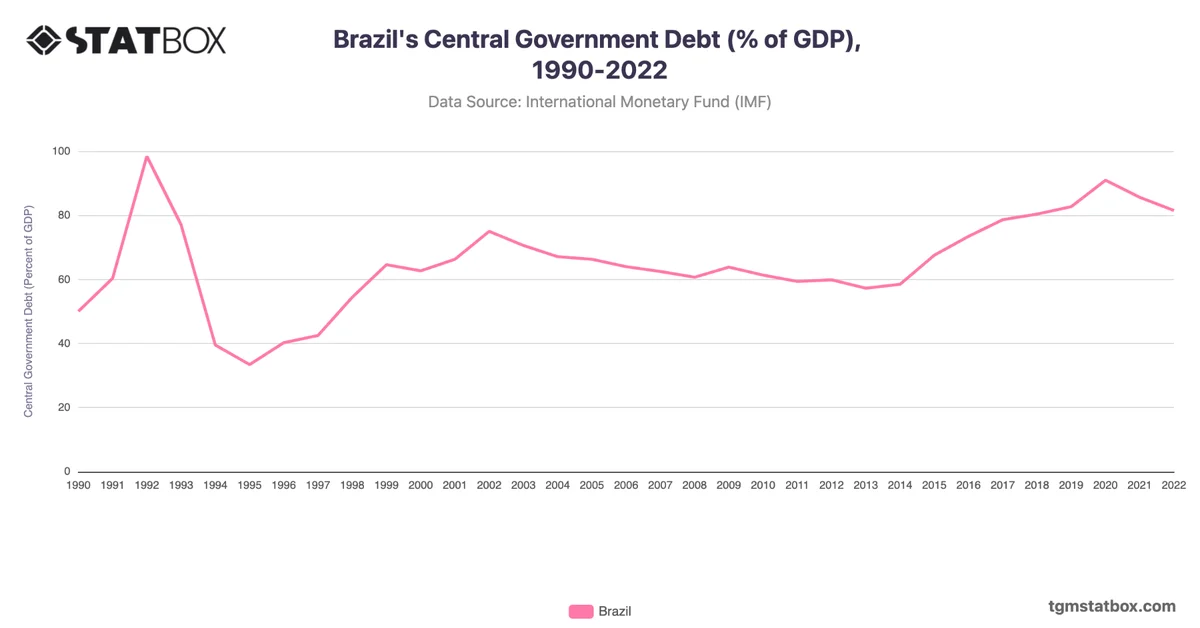
Brazil’s fiscal trends reveal a complex interplay of economic cycles and policy challenges. The early 2000s saw consistent deficits, averaging -4%, reflecting fiscal pressures and structural inefficiencies. A period of modest improvement in the 2000s, with deficits narrowing to -2.3% in 2008, was disrupted by the global financial crisis and a sharp decline in commodity prices, pushing the deficit back to -3.2% by 2009.
Economic mismanagement during the mid-2010s, coupled with a severe recession, saw deficits peak at -8.8% in 2015. The COVID-19 pandemic further worsened Brazil’s fiscal balance, with a record deficit of -11.9% in 2020 due to emergency spending and economic contraction. While the deficit narrowed to -2.5% in 2021, projections for 2023-2029 suggest stabilization around -4.4%, as Brazil focuses on structural reforms and economic recovery.
Economic mismanagement during the mid-2010s, coupled with a severe recession, saw deficits peak at -8.8% in 2015. The COVID-19 pandemic further worsened Brazil’s fiscal balance, with a record deficit of -11.9% in 2020 due to emergency spending and economic contraction. While the deficit narrowed to -2.5% in 2021, projections for 2023-2029 suggest stabilization around -4.4%, as Brazil focuses on structural reforms and economic recovery.
For a deeper dive into the topic, explore Brazil’s unemployment rate, Brazil’s military personnel proportion, Fertility rate in Brazil.