Omnichannel Preference Variation Across Christmas Budget Segments
Christmas gift purchasing decisions involve trade-offs between convenience, price comparison, product availability, and the tactile experience of in-store browsing. How consumers allocate spending across channels is closely tied to the scale and nature of their intended purchases, making budget level a meaningful lens for understanding retail channel preference.
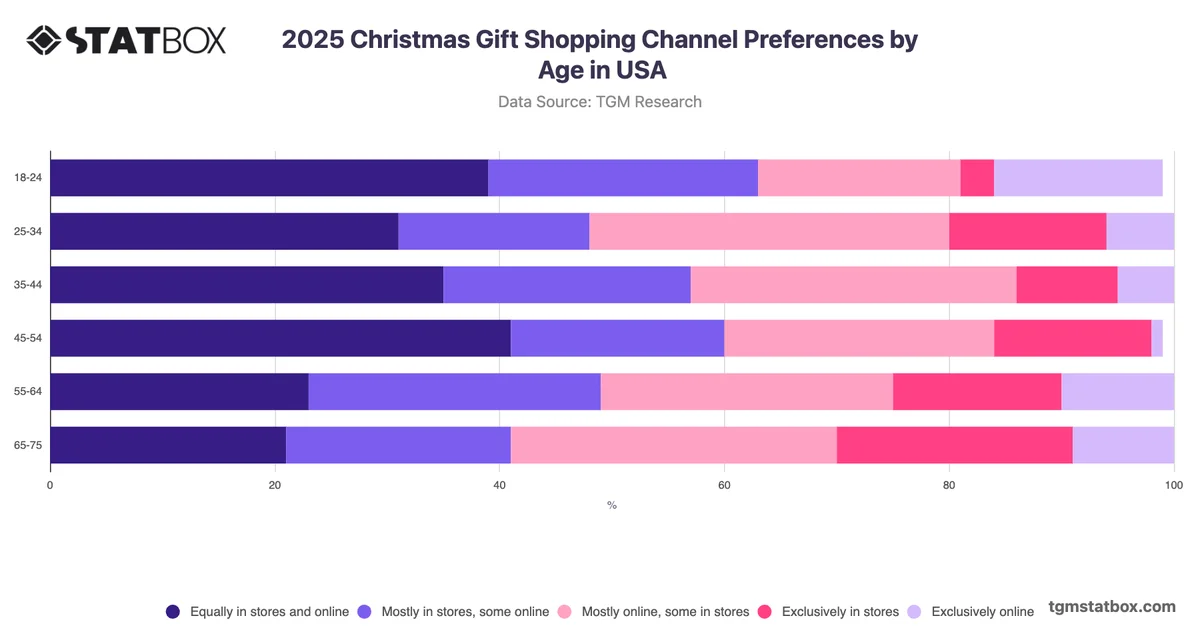
The most notable pattern in Christmas gift shopping channel preference in the USA is the concentration of blended channel behaviour among higher-spending consumers, contrasted with greater channel polarisation at the lowest spending tier. Among those planning to spend $1,000 or more, 45% intend to shop equally in stores and online, a proportion considerably higher than any other spending group. Meanwhile, consumers spending under $99 are the most likely to shop exclusively in stores (26%) or exclusively online (16%), suggesting that lower-budget shoppers tend toward a single channel rather than combining both. Higher-spending consumers appear more comfortable managing a multichannel approach, possibly because larger gift lists or higher-value items warrant broader search across formats. Retailers targeting premium holiday spenders may benefit from investing in consistent cross-channel product discovery and fulfilment experiences, while value-oriented messaging may perform more efficiently when concentrated within a single channel environment.