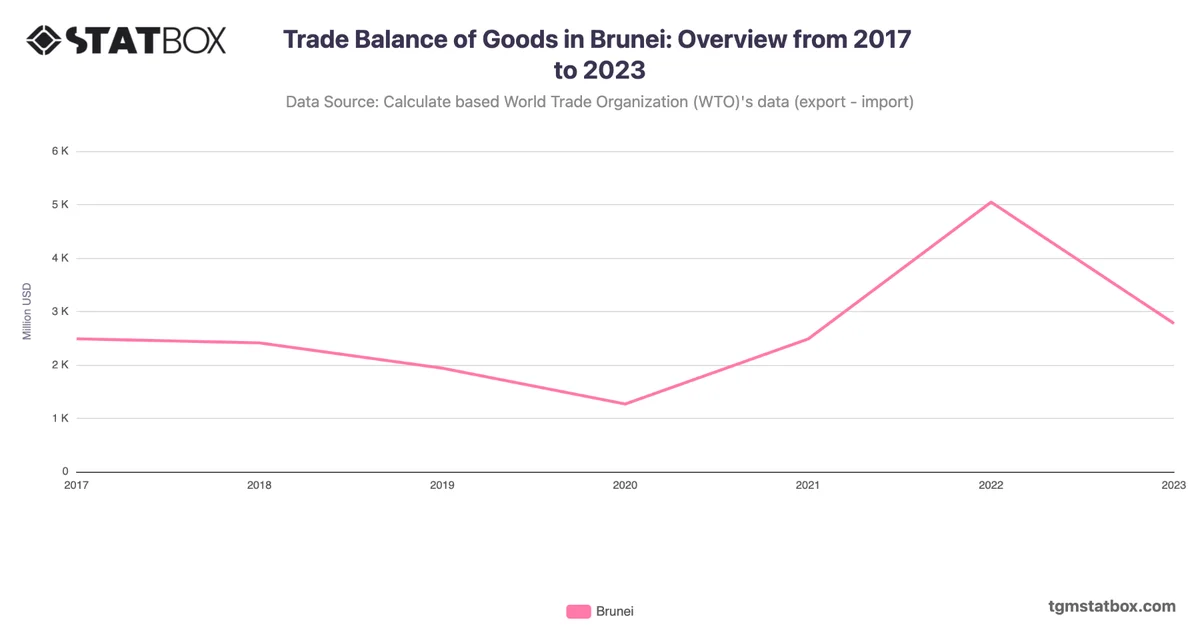
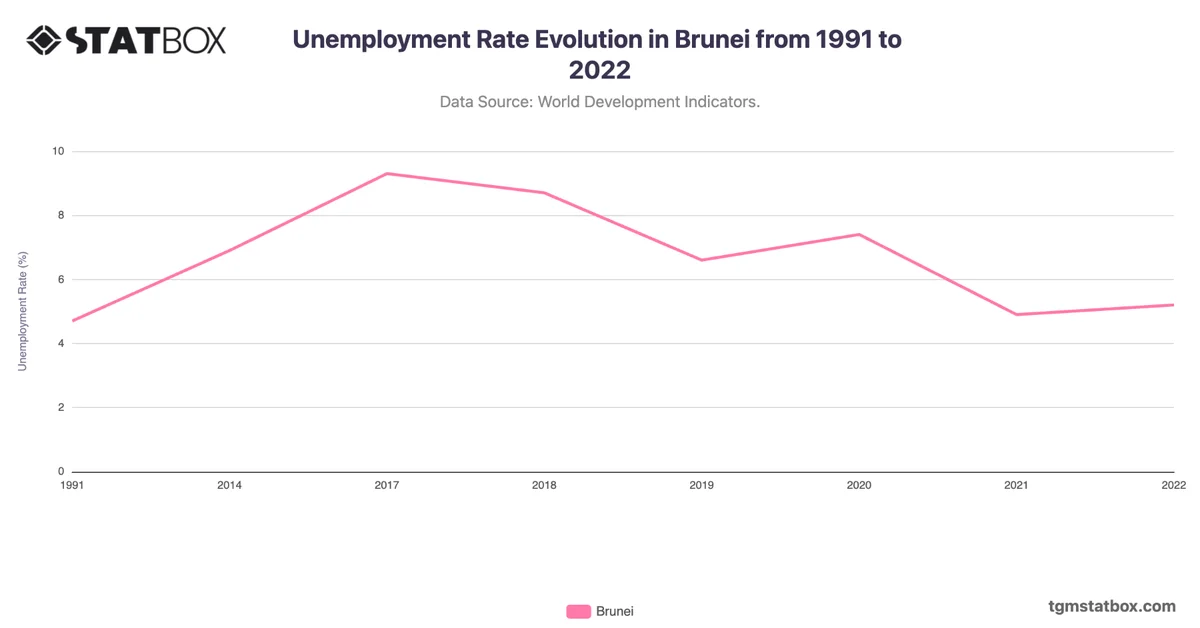
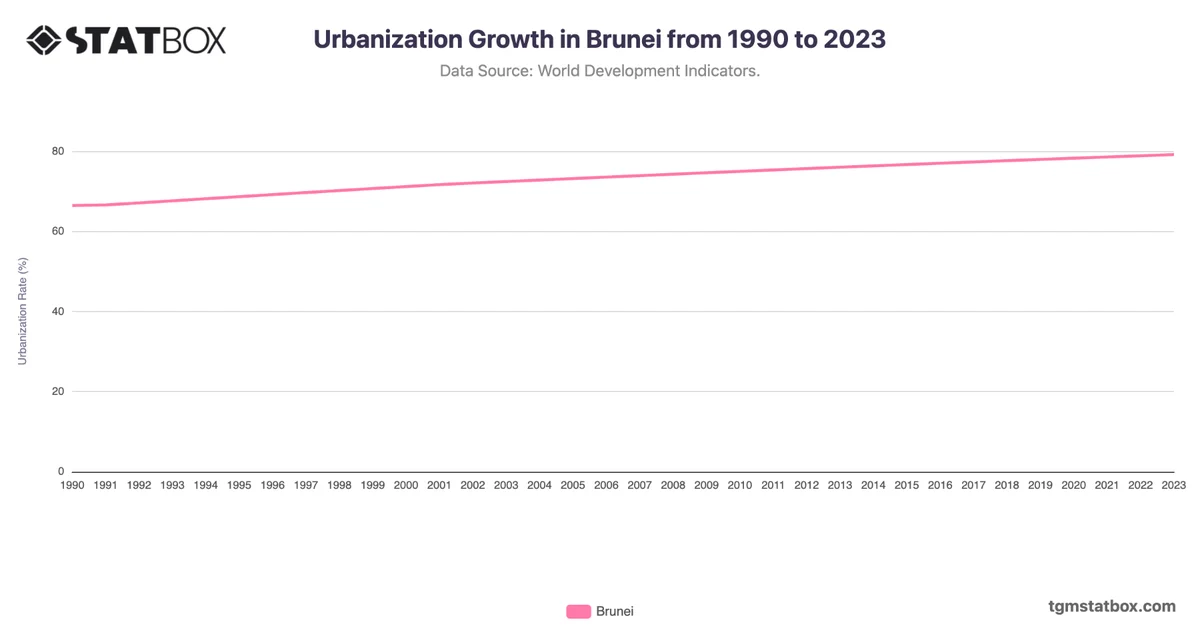
Brunei Darussalam’s export of goods has demonstrated fluctuations over the years, heavily influenced by its oil and gas exports, which make up a significant portion of its trade. The chart shows a gradual increase from 1990, starting at $2.2 billion, reaching a peak in 2012 at $13 billion, driven by high global oil prices. This growth continued through the early 2010s, with exports surpassing $12 billion in 2011 and 2012. However, a sharp decline followed in 2015, dropping to $6.4 billion, attributed to the global oil price crash and a decrease in production.
In recent years, Brunei’s export value has remained volatile, reflecting the country’s reliance on natural resources. The value in 2022 peaked again at $14.2 billion, but in 2023, it decreased to $11.2 billion, likely due to market fluctuations and global supply chain disruptions. Despite these fluctuations, Brunei continues to focus on diversifying its export base beyond oil and gas to include products such as palm oil, rubber, and petrochemicals, which have provided some stability in recent years.
In recent years, Brunei’s export value has remained volatile, reflecting the country’s reliance on natural resources. The value in 2022 peaked again at $14.2 billion, but in 2023, it decreased to $11.2 billion, likely due to market fluctuations and global supply chain disruptions. Despite these fluctuations, Brunei continues to focus on diversifying its export base beyond oil and gas to include products such as palm oil, rubber, and petrochemicals, which have provided some stability in recent years.
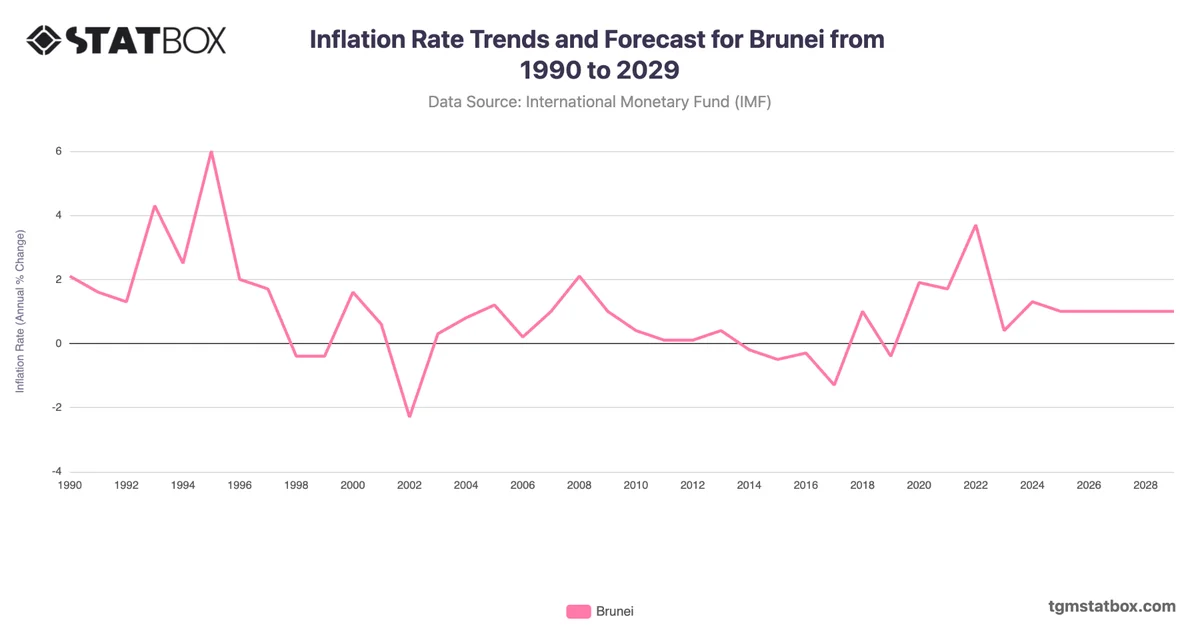
Find out more through related statistics on Brunei’s annual GDP growth rate, Brunei’s agriculture share in GDP, Brunei’s inflation rate forecast.