Brunei’s inflation has remained relatively subdued, with deflationary periods such as -2.3% in 2002 due to economic slowdowns. Inflation spikes, such as 6.0% in 1995, were often linked to fluctuations in global oil prices, a key factor in Brunei's oil-dependent economy.
Post-2022, inflation dropped sharply from 3.7% to 0.4% in 2023, reflecting normalization after pandemic-related disruptions. Forecasts predict a stable inflation rate of 1% from 2025 onwards, underpinned by Brunei’s fiscal discipline and reliance on steady oil revenues.
Post-2022, inflation dropped sharply from 3.7% to 0.4% in 2023, reflecting normalization after pandemic-related disruptions. Forecasts predict a stable inflation rate of 1% from 2025 onwards, underpinned by Brunei’s fiscal discipline and reliance on steady oil revenues.
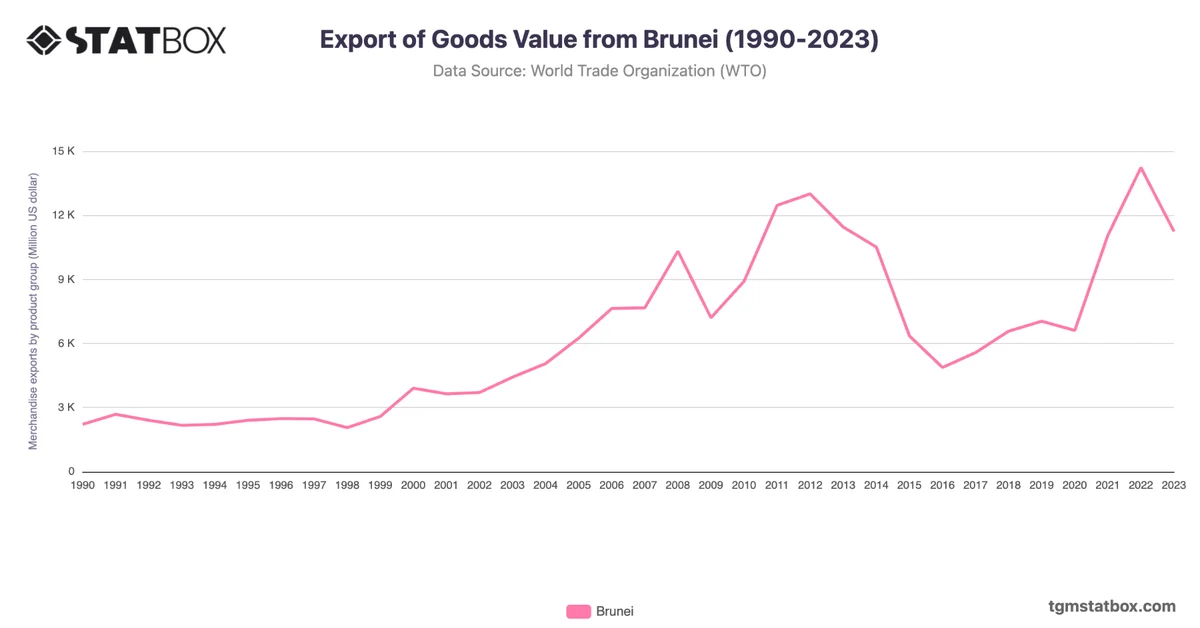
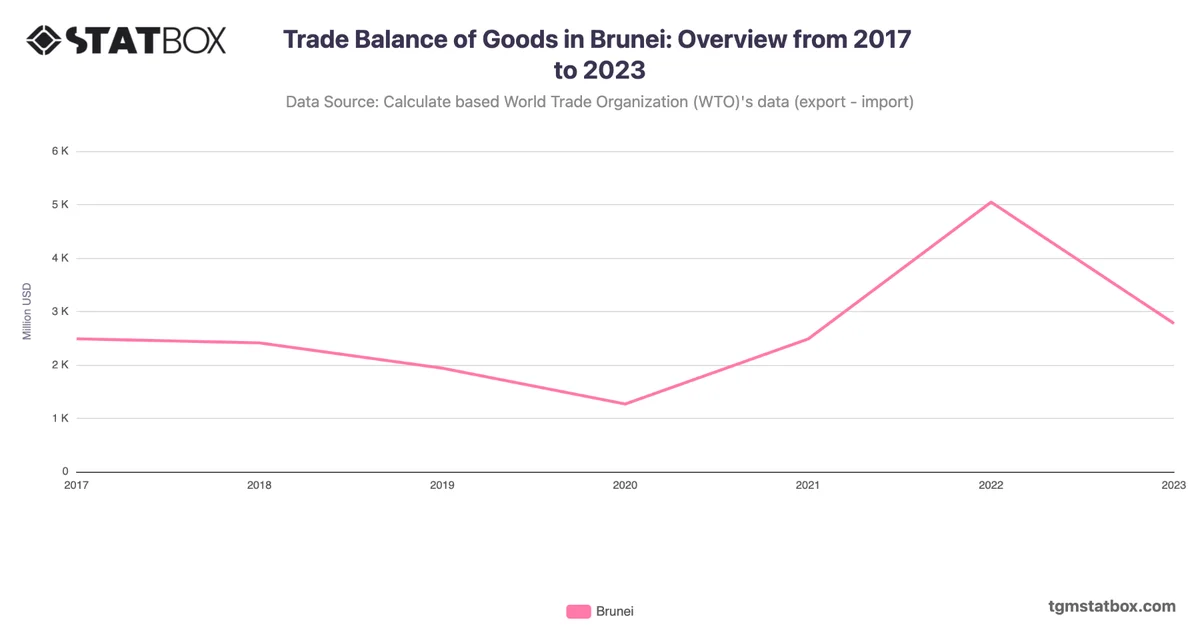
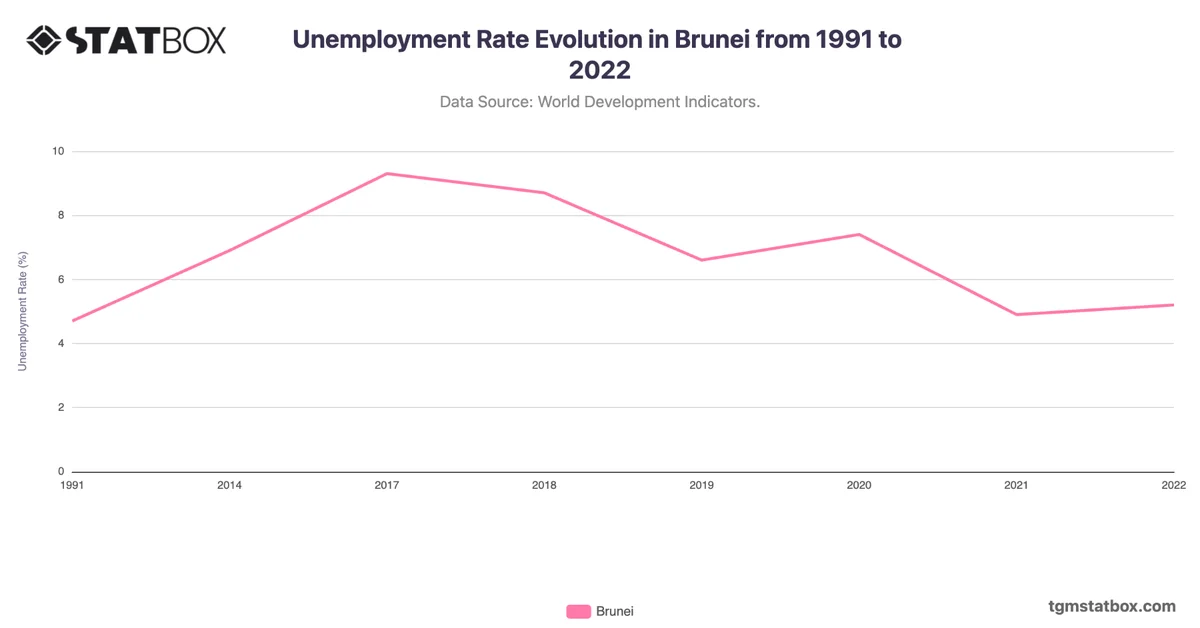
Find out more through related statistics on Brunei’s unemployment trend, Brunei’s goods export value, Brunei’s population trend.