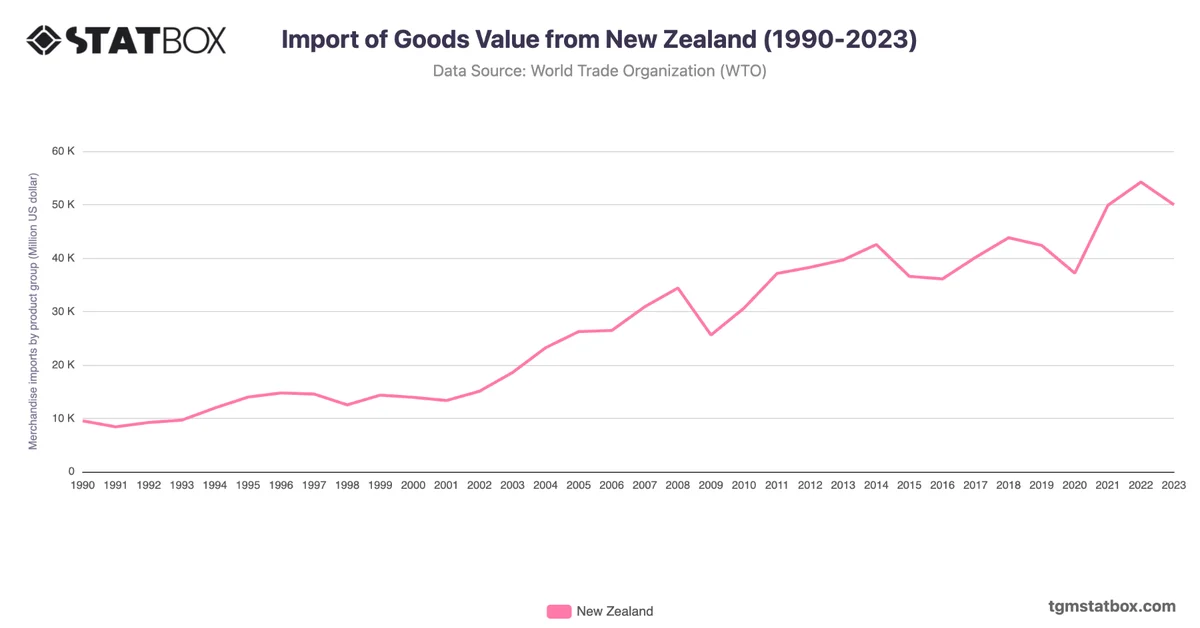
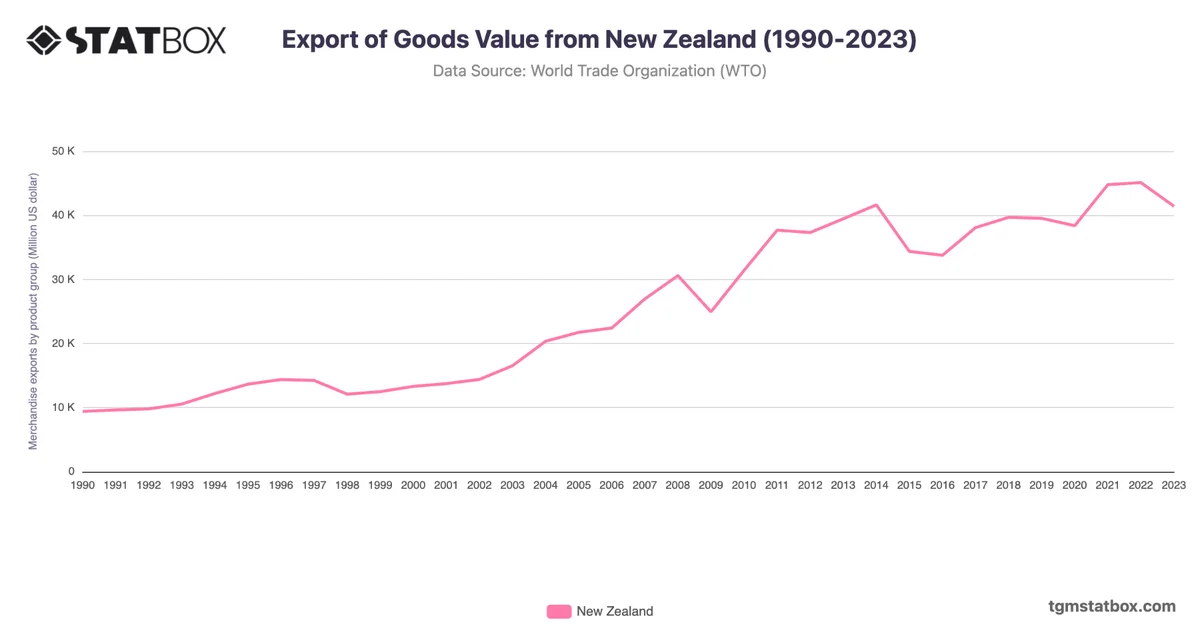
New Zealand’s trade balance of goods fluctuated between deficit and surplus, with persistent deficits dominating the 2017–2023 period. The country recorded a surplus of 1,224.8 million USD in 2020, driven by reduced imports during the pandemic and stable exports of dairy and meat products. However, the trade deficit widened significantly to -9,117.2 million USD in 2022, reflecting increased import costs for machinery, fuel, and consumer goods.
By 2023, the deficit slightly improved to -8,514.1 million USD, supported by steady export growth in agricultural goods, although high import dependency continued to weigh on the trade balance. New Zealand’s trade dynamics reflect the importance of its agricultural sector while underscoring vulnerabilities to global commodity price changes and supply chain disruptions.
By 2023, the deficit slightly improved to -8,514.1 million USD, supported by steady export growth in agricultural goods, although high import dependency continued to weigh on the trade balance. New Zealand’s trade dynamics reflect the importance of its agricultural sector while underscoring vulnerabilities to global commodity price changes and supply chain disruptions.
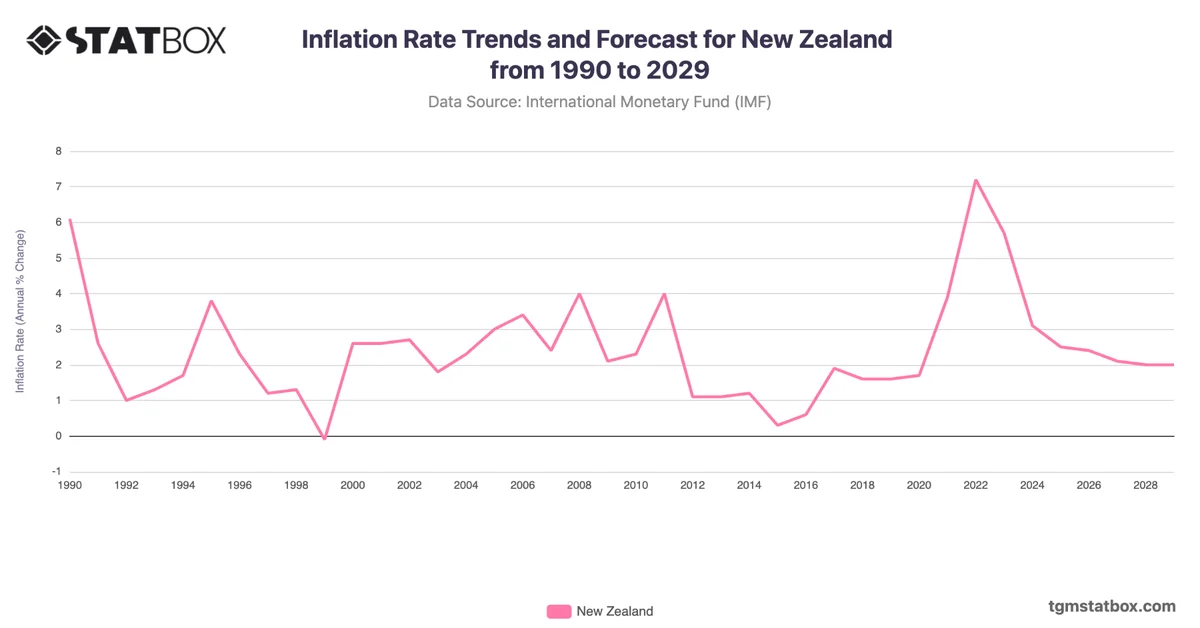
Explore related charts to gain a better understanding of New Zealand’s yearly GDP growth rate, New Zealand’s inflation rate trends, import value from New Zealand.