The "Population Growth Trends in Brunei from 1990 to 2023" chart highlights a steady decline in growth rates over the decades, reflecting Brunei’s demographic transition toward lower fertility and a stable population.
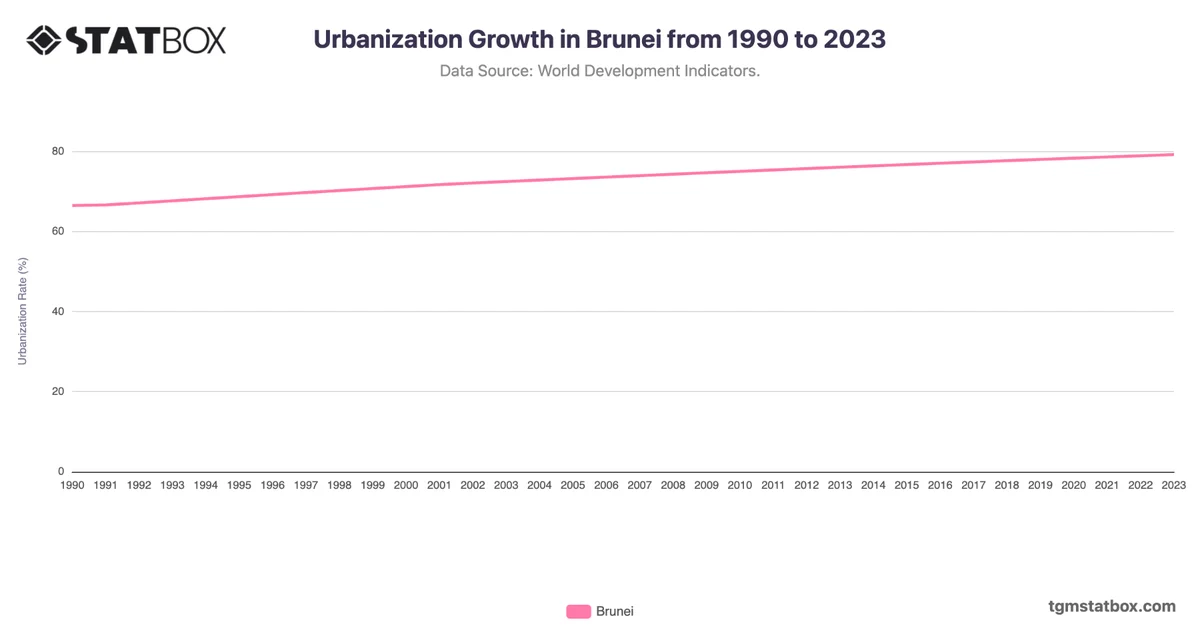
In 1990, Brunei’s growth rate was at a high of 3.1%, a reflection of the country's youthful population and high fertility rates at the time. This rate gradually decreased through the 1990s, falling to 2.1% by 2000, as social and economic factors shifted, leading to smaller family sizes and increased urbanization.
From the early 2000s, Brunei’s growth rate continued a consistent decline, reaching 1.5% by 2008 and eventually stabilizing at around 1.0% by 2017. Improvements in healthcare, family planning access, and economic development contributed to this trend as the population growth adjusted to new demographic norms.
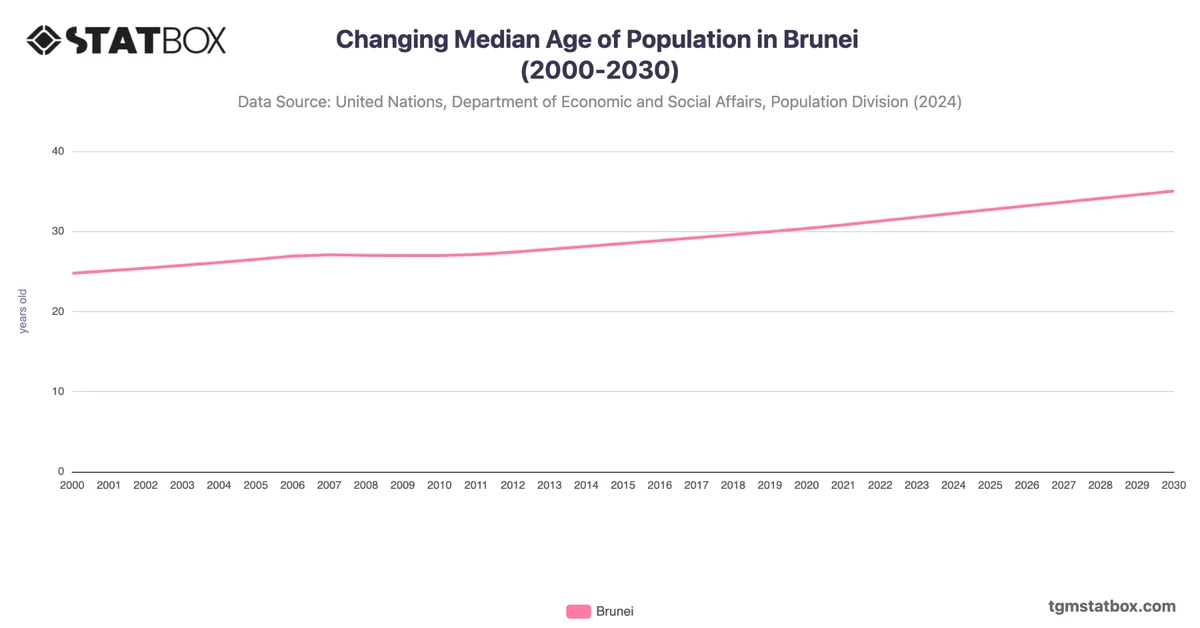
Since 2020, growth has plateaued at 0.8%, indicating a further stabilization that reflects Brunei's evolution towards a low-growth population. This trend underscores Brunei’s shift to a mature demographic structure, with implications for future workforce needs and sustainable development planning as the nation moves toward an aging population.
In 1990, Brunei’s growth rate was at a high of 3.1%, a reflection of the country's youthful population and high fertility rates at the time. This rate gradually decreased through the 1990s, falling to 2.1% by 2000, as social and economic factors shifted, leading to smaller family sizes and increased urbanization.
From the early 2000s, Brunei’s growth rate continued a consistent decline, reaching 1.5% by 2008 and eventually stabilizing at around 1.0% by 2017. Improvements in healthcare, family planning access, and economic development contributed to this trend as the population growth adjusted to new demographic norms.
Since 2020, growth has plateaued at 0.8%, indicating a further stabilization that reflects Brunei's evolution towards a low-growth population. This trend underscores Brunei’s shift to a mature demographic structure, with implications for future workforce needs and sustainable development planning as the nation moves toward an aging population.
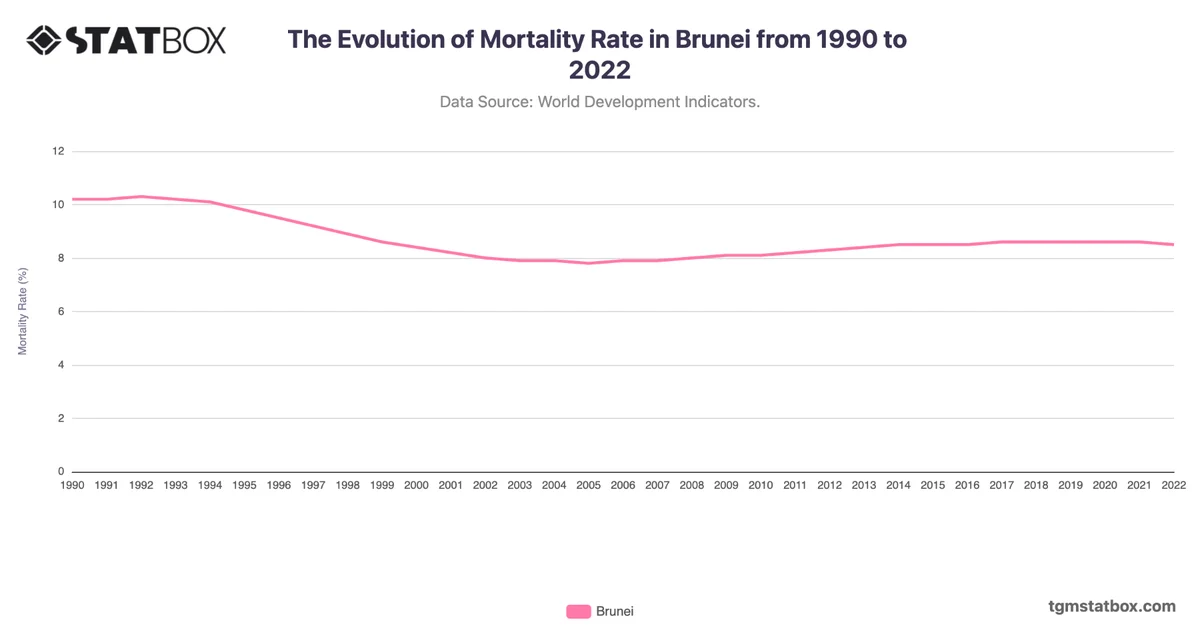
Find out more through related statistics on Brunei’s unemployment trend, Brunei’s agriculture share in GDP, Brunei’s shifting death rate.