Cambodia's Net ODA (% of GNI) peaked at 15.0% in 1995, reflecting substantial post-conflict reconstruction and international assistance following the Paris Peace Agreements. Aid levels gradually declined as Cambodia stabilized, though they remained above 5%, signifying continued donor engagement in poverty alleviation and infrastructure development.
An uptick to 5.5% in 2020 aligns with pandemic-related aid to mitigate the economic impacts of COVID-19. While ODA has decreased over time, Cambodia remains heavily reliant on external assistance for development, particularly in rural infrastructure and education.
An uptick to 5.5% in 2020 aligns with pandemic-related aid to mitigate the economic impacts of COVID-19. While ODA has decreased over time, Cambodia remains heavily reliant on external assistance for development, particularly in rural infrastructure and education.
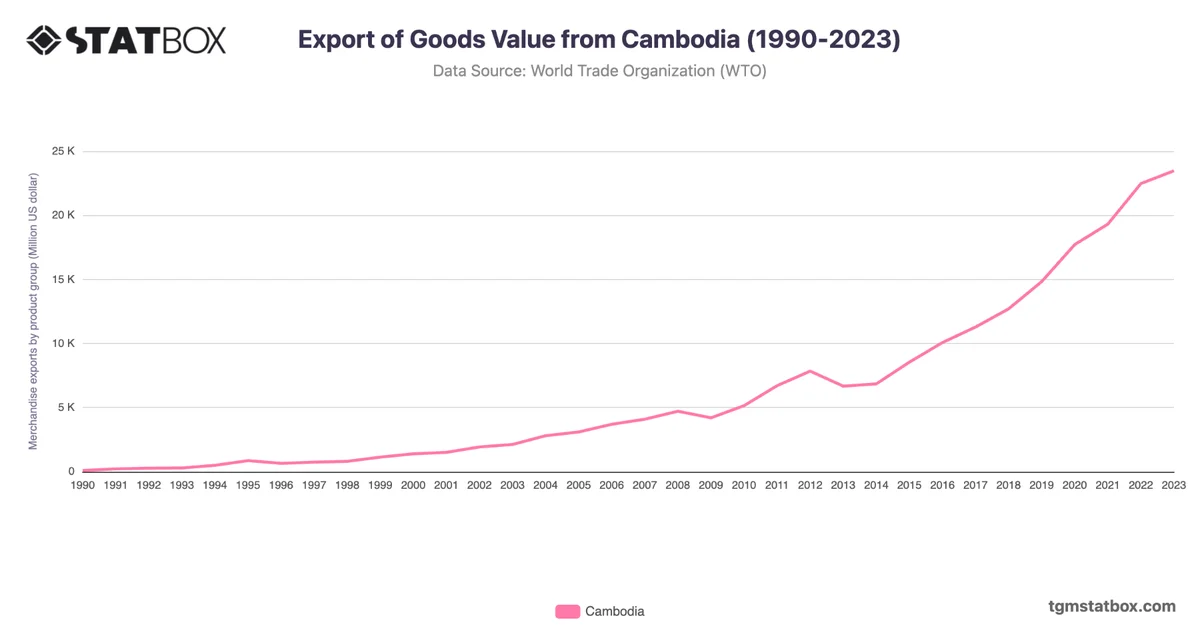
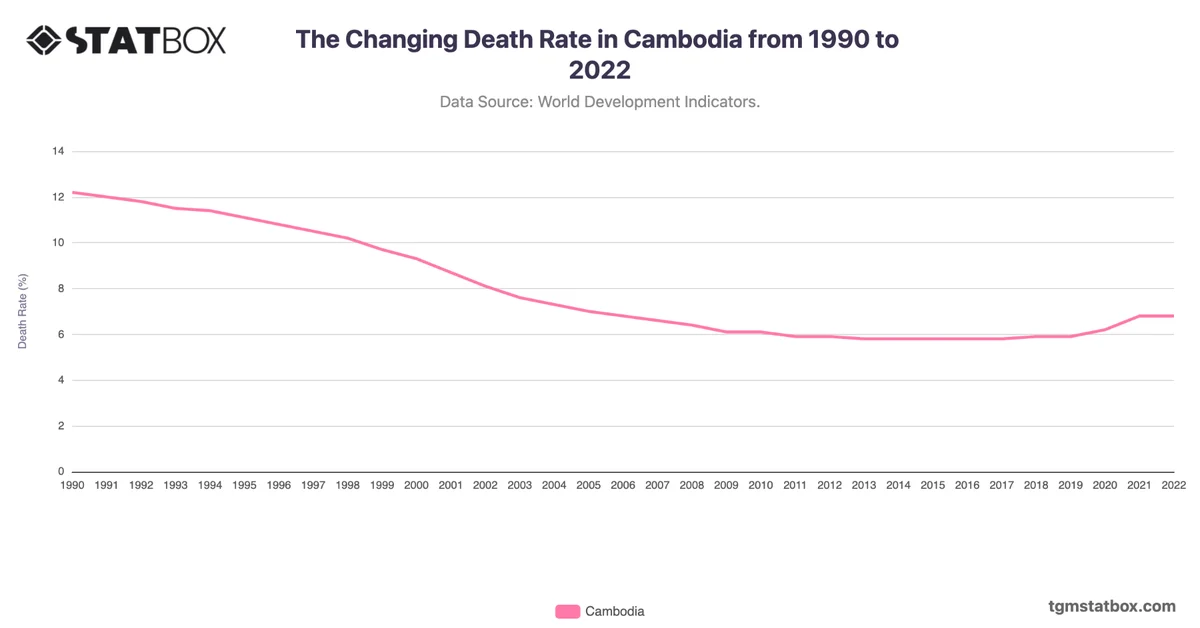
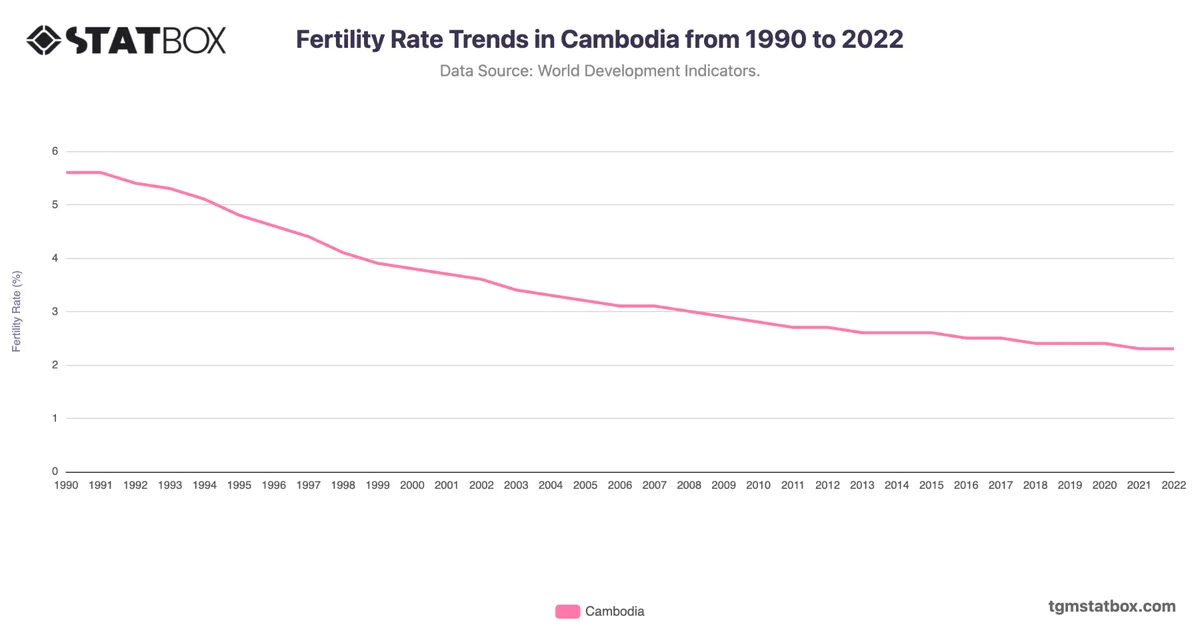
Discover additional trends and data on Cambodia’s government debt data, Cambodia’s export value, Cambodia’s fertility rate trends.