China’s general government debt remained relatively low through the 1990s and early 2000s, staying around 20-25% of GDP as the economy rapidly expanded. However, debt levels began rising significantly after the global financial crisis of 2008, climbing from 27.2% in 2008 to 34.6% in 2009. This increase was largely due to substantial stimulus efforts aimed at boosting the domestic economy and maintaining high growth rates in the face of global economic uncertainty.
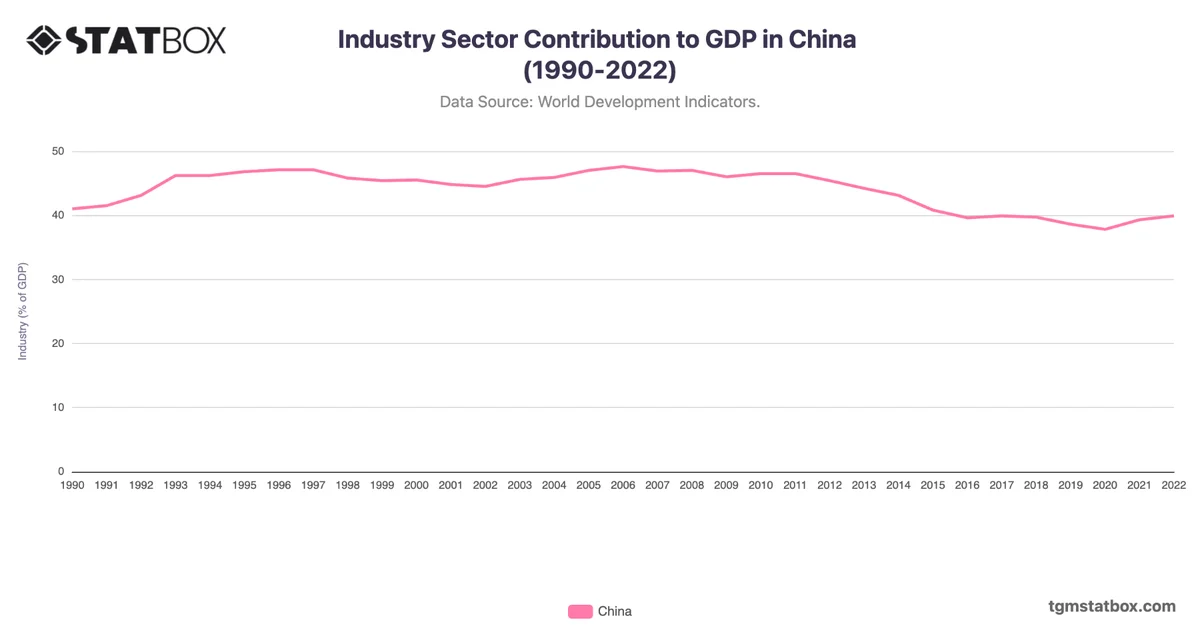
From 2016 onward, debt continued to escalate, driven by efforts to maintain growth as the economy transitioned from manufacturing to services and technology. By 2022, debt had risen to 77.1% of GDP, reflecting fiscal policies aimed at economic stabilization during the COVID-19 pandemic. The government’s increased debt levels reflect both a response to economic challenges and the structural shift toward a more consumption-driven economy, underscoring China’s balancing act between growth and debt sustainability.
From 2016 onward, debt continued to escalate, driven by efforts to maintain growth as the economy transitioned from manufacturing to services and technology. By 2022, debt had risen to 77.1% of GDP, reflecting fiscal policies aimed at economic stabilization during the COVID-19 pandemic. The government’s increased debt levels reflect both a response to economic challenges and the structural shift toward a more consumption-driven economy, underscoring China’s balancing act between growth and debt sustainability.
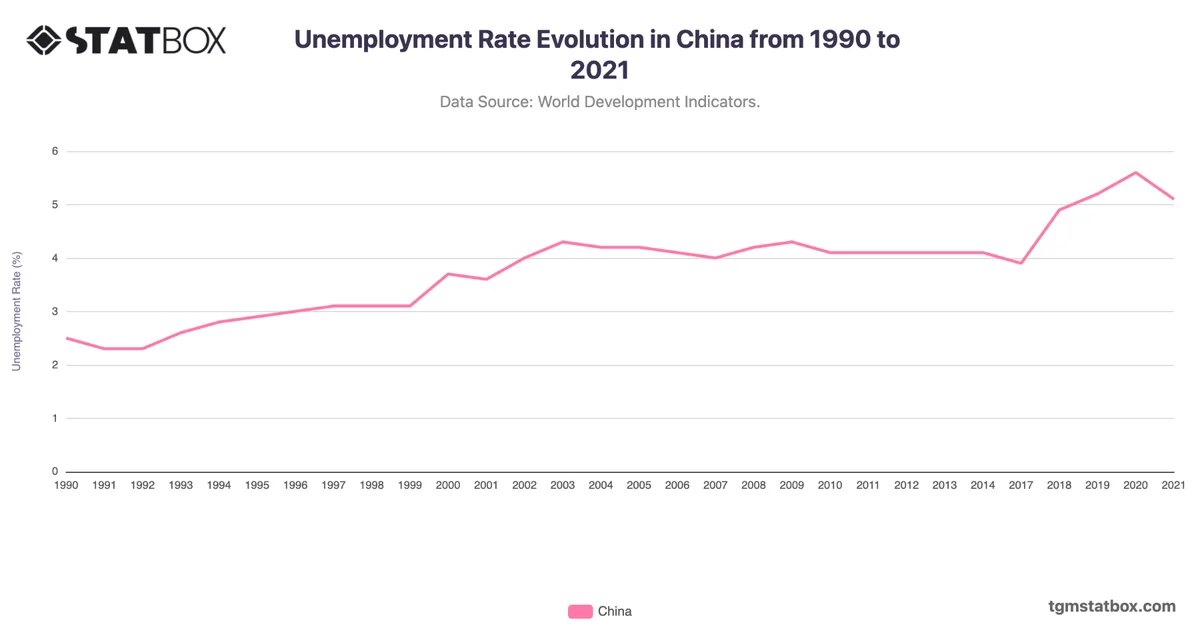
Find out more through related statistics on China’s services sector share in GDP, China’s unemployment rate trend, China’s manufacturing sector share in GDP.