Spending Level Variation in Italian Christmas Purchase Intentions
Christmas gift-giving involves a range of product categories that span personal, household, and experiential domains. Budget allocation decisions vary considerably across consumer segments, and understanding how spending levels relate to category selection is central to effective seasonal planning for retailers and brand managers operating in Italy.
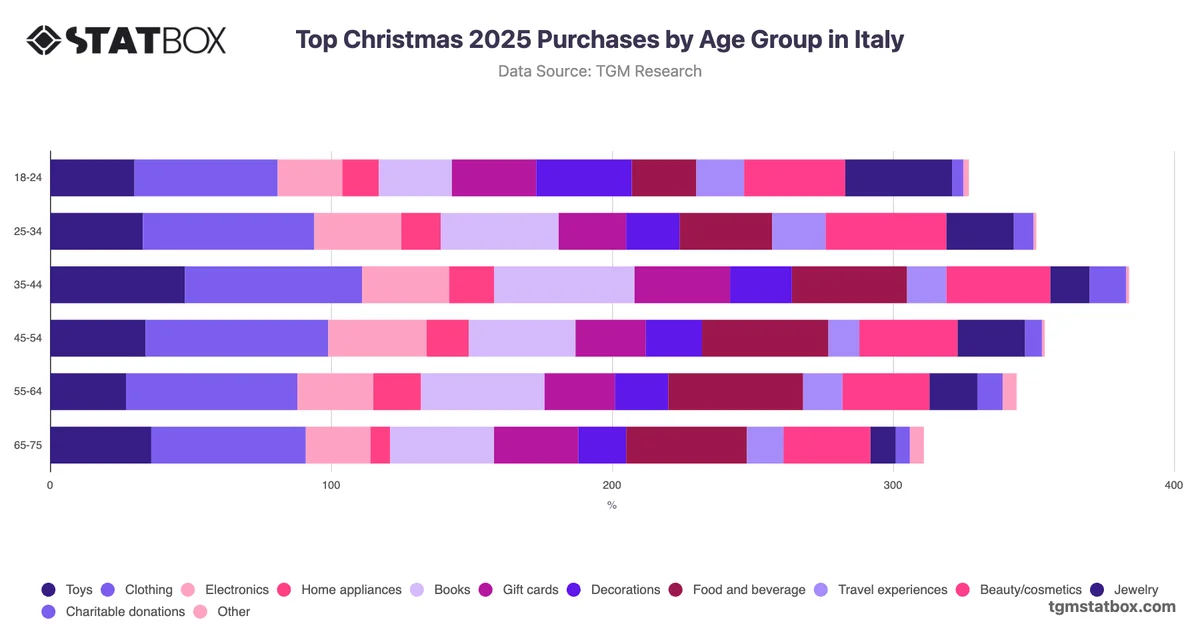
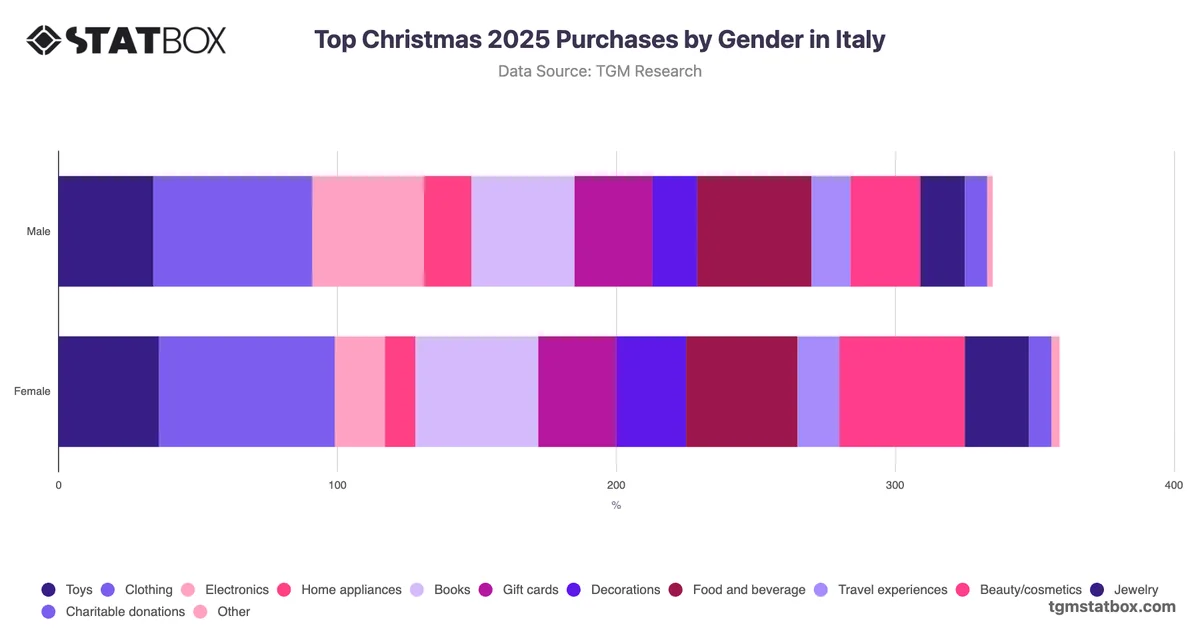
The most analytically notable pattern is that clothing maintains consistently strong purchase intent across all spending tiers, ranging from 45% among those spending under $99 to 79% among the $500–$999 group, making it the most stable category across the income spectrum. By contrast, books and food and beverages perform strongly at mid-to-high spending levels but drop considerably among the lowest tier, suggesting these categories are not treated as default low-budget choices. Electronics follow a similar concentration at higher spending levels, with the under-$99 group recording just 14% compared to 44% among the $1,000+ segment. This polarisation between low and higher spenders indicates that category relevance is strongly conditioned by budget availability rather than universal gifting convention. Retailers targeting lower-spending consumers may find greater traction by prioritising clothing and gift cards, which retain relatively broader acceptance across all spending brackets.