Age-Based Concentration in Christmas Gift Spending Ranges
Gift-giving during the Christmas period represents a significant allocation of household discretionary spending in Italy. The distribution of that spending across price ranges is shaped by factors including household composition, income, and the number of recipients, making age a relevant variable in understanding how budgets are structured.
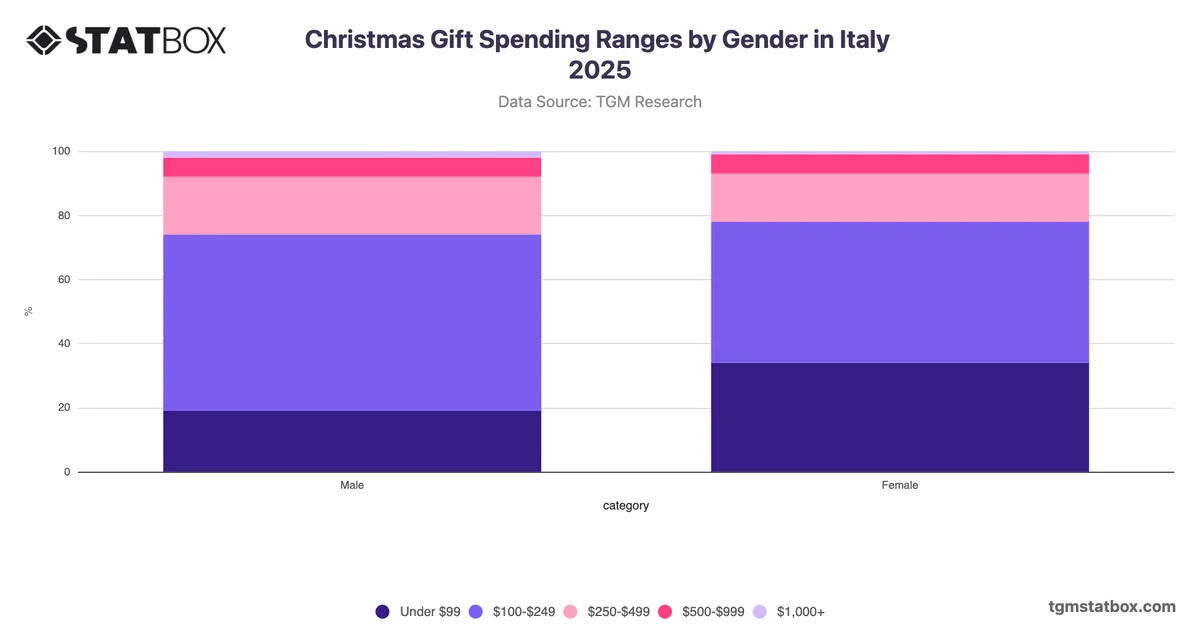
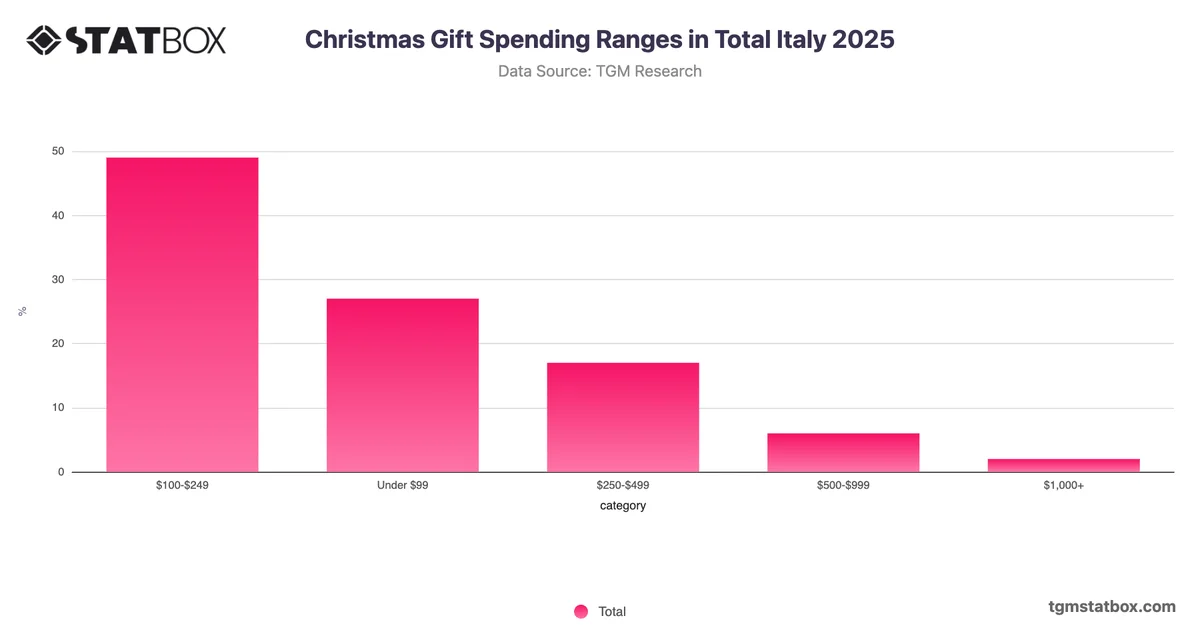
The most notable pattern across age groups in Italy is the strong concentration of Christmas gift spending within the $100–$249 range, with 35–44-year-olds and 55–64-year-olds anchoring particularly firmly in this bracket at 50% and 56% respectively. What is less immediately apparent is the relative suppression of higher-tier spending across all groups: the $500–$999 and $1,000-plus categories combined account for no more than 11% in any age segment, and fall to just 4% among 35–44-year-olds. This points to a broadly mid-range spending culture with limited appetite for premium gift budgets, regardless of age. The youngest cohort, 18–24-year-olds, shows the highest proportion spending under $99 at 32%, consistent with tighter budget constraints at that life stage. For retailers and gift brands, these patterns suggest that mid-range price positioning warrants priority, while premium offerings may require more targeted segmentation by household income rather than age alone.