Age-Based Variation in Christmas Gift Shopping Channel Preferences
How consumers divide their Christmas gift purchases between physical stores and digital platforms reflects broader tensions in retail behaviour. Channel choice is rarely fixed, as shoppers weigh convenience, product type, and personal habit when deciding where to buy. Understanding how these trade-offs vary across age groups is central to effective retail planning and communication strategy.
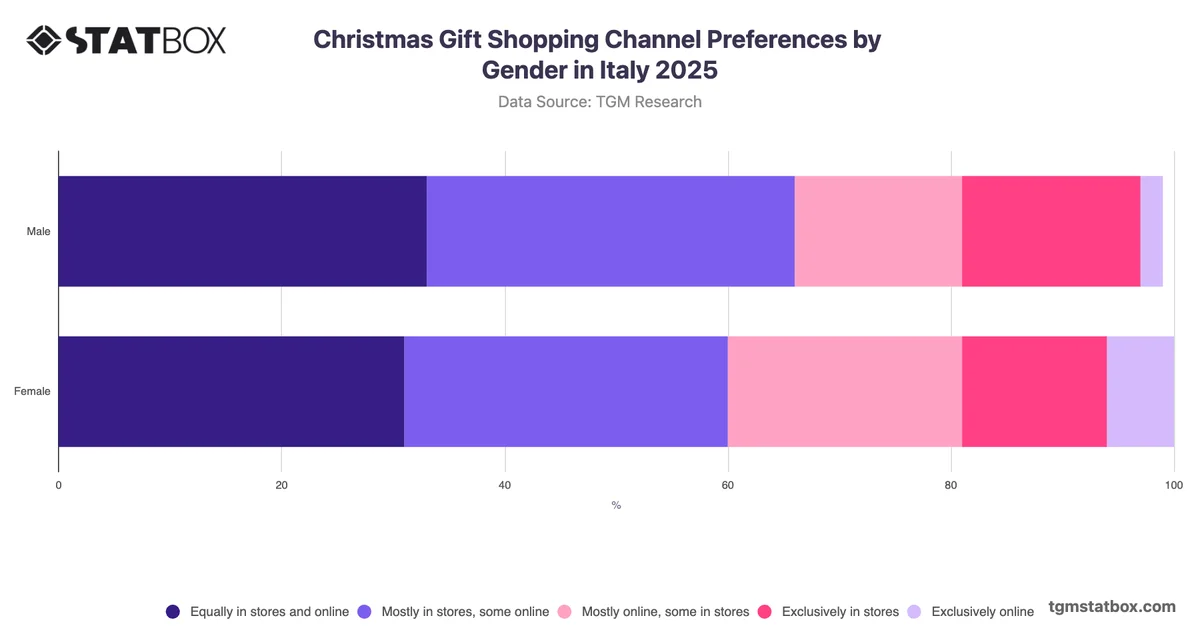
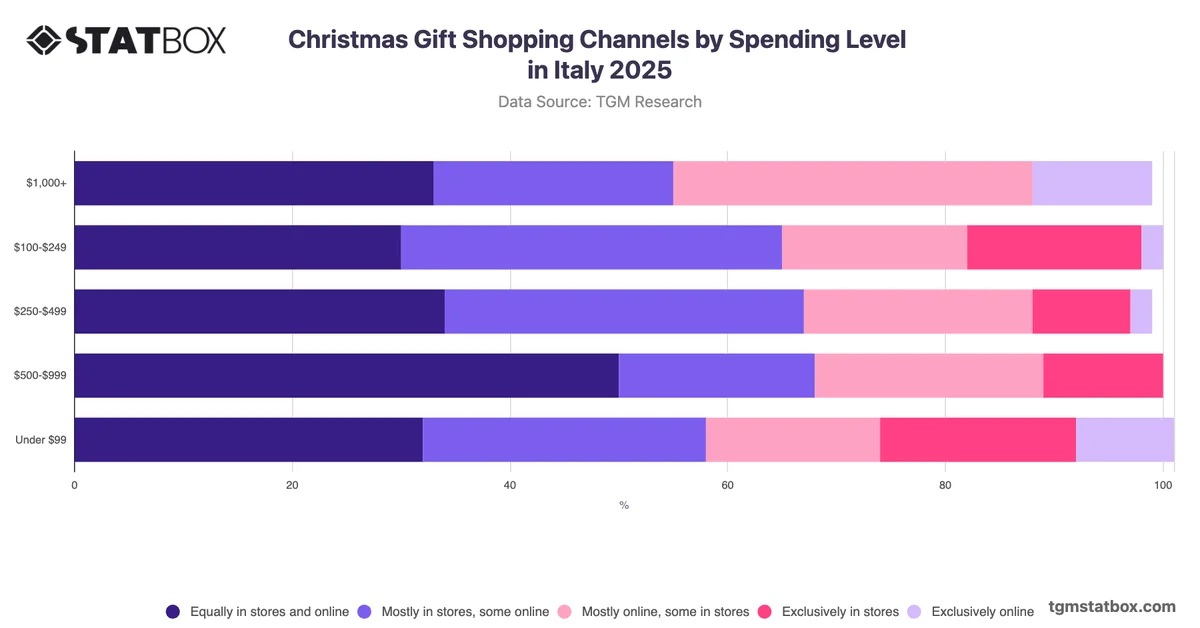
The most analytically significant pattern in Christmas gift shopping channel preferences in Italy is not a clear preference for either stores or online, but rather a structural concentration around blended behaviour across nearly all age groups. The 35–44 cohort stands out, with 42% selecting an equal store and online split, the highest share of any group for that option. In contrast, older consumers aged 65–75 are notably more inclined toward exclusively in-store shopping at 23%, compared to just 7% among 35–44 year-olds, a gap that points to meaningful generational differences in channel commitment. Younger adults aged 25–34 lean toward store-led behaviour, with 44% preferring mostly in-store with some online activity. Exclusively online purchase intent remains marginal across all age groups, suggesting that full digital adoption for Christmas gifting is limited. Retailers planning channel investment should consider targeting middle-aged segments with integrated online and in-store propositions, while maintaining accessible physical touchpoints for older consumers who retain a clear preference for in-store experiences.