Price Sensitivity and Quality Priorities Across Spending Segments
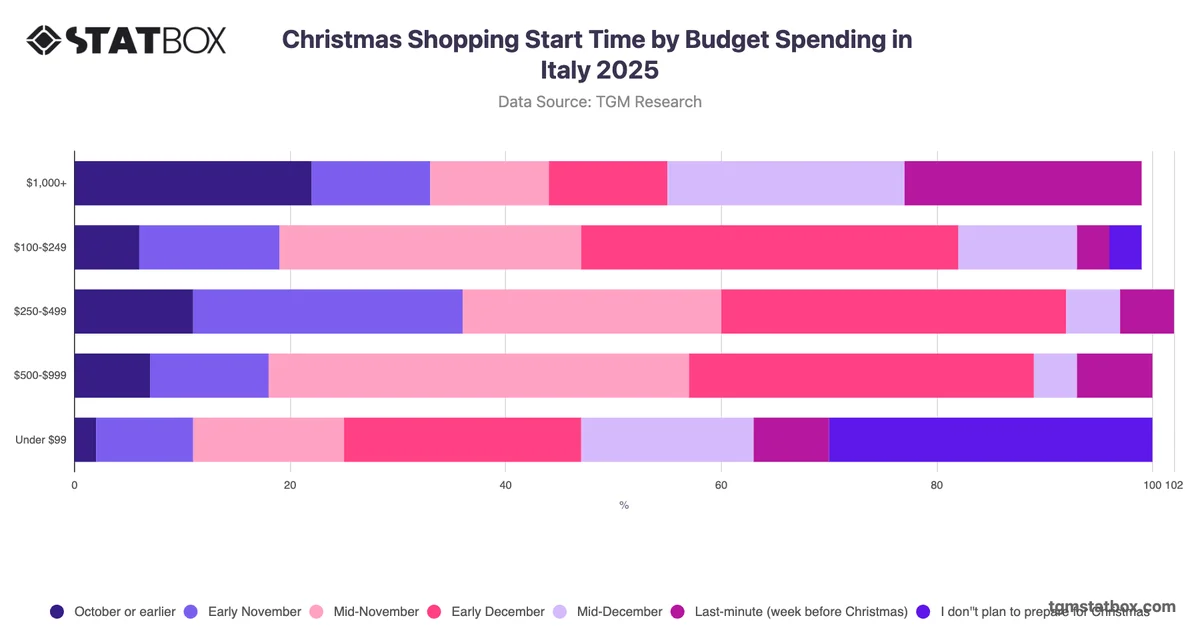
Christmas shopping decisions involve a complex interplay of economic constraints, personal values, and product expectations. The relative weight consumers place on price versus quality tends to vary considerably depending on how much they intend to spend, making budget level a meaningful lens for understanding purchase priorities in Italy.
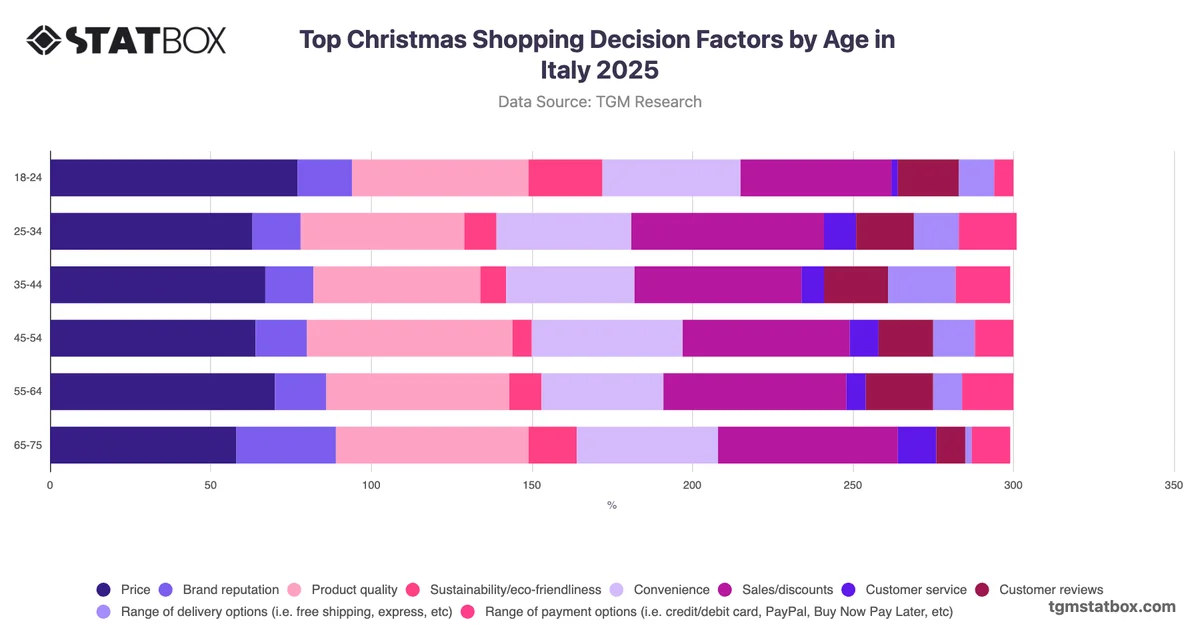
The most analytically significant pattern is a clear inversion between price sensitivity and product quality prioritisation as spending levels increase. Among those spending under $99, price is cited by 75% and product quality by 46%, whereas among those spending $1,000 or more, product quality reaches 78% while price falls to just 11%, a gap of 64 percentage points. This suggests that higher-spending Italian consumers are not primarily driven by cost considerations but by perceived product merit. Sales and discounts follow a similar gradient, declining steadily from 65% among the lowest spenders to 22% among the highest. For retailers and brands targeting premium segments, messaging centred on quality assurance and product credentials is likely to be more persuasive than promotional pricing, while value-oriented communication remains critical for reaching lower-budget shoppers.