Price Sensitivity Versus Value Complexity in Italian Christmas Shopping
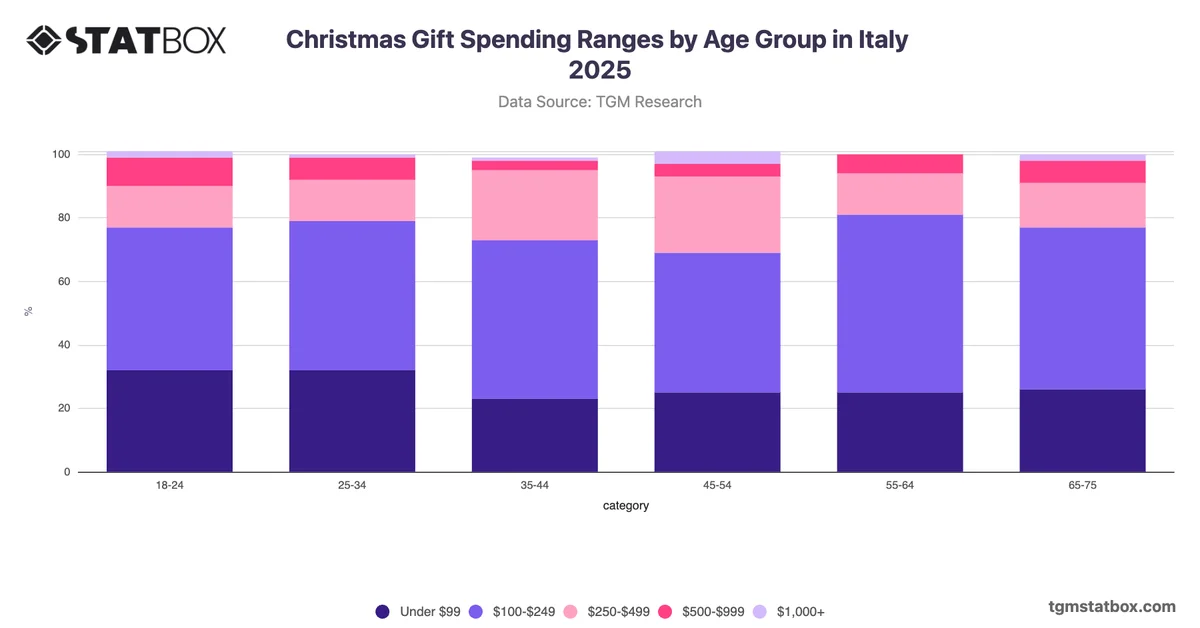
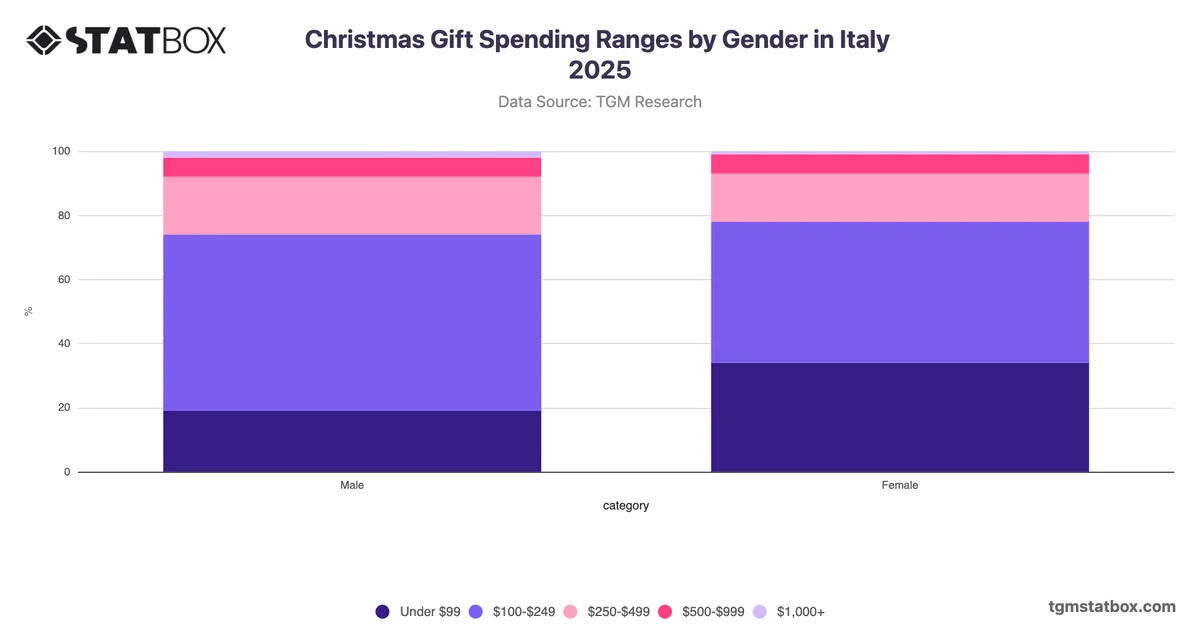
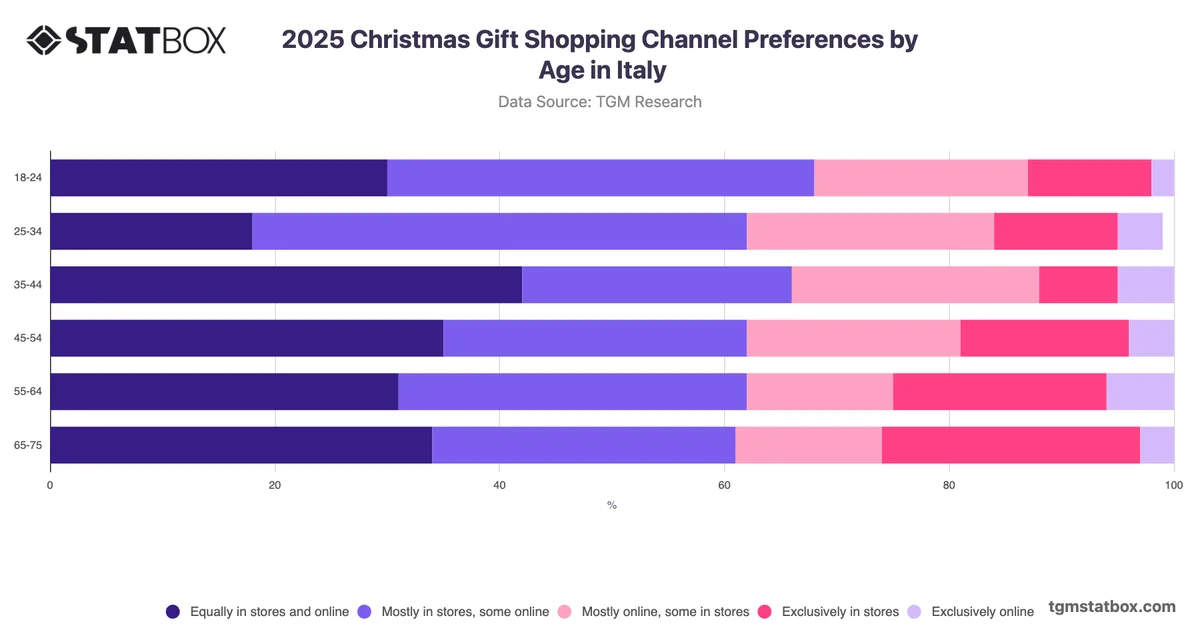
Christmas shopping represents one of the most concentrated periods of consumer expenditure in the annual calendar. During this period, purchasing decisions are shaped by a combination of financial considerations, product expectations, and logistical preferences, making it a useful lens for understanding how consumers balance competing priorities under time and budget pressure.
The most analytically significant pattern in Italian Christmas shopping decisions is the clear concentration of priority around three value-oriented factors: price at 66%, product quality at 57%, and sales and discounts at 54%. The proximity of these three figures suggests that Italian consumers do not treat price alone as the dominant criterion; rather, they apply a combined value assessment that weighs cost against quality and promotional timing simultaneously. This points to a consumer mindset that is cost-conscious but not indifferent to product standards. By contrast, brand reputation, customer reviews, and sustainability each register below 20%, indicating these factors carry limited weight at the decision stage. Retailers and brands targeting Italian Christmas shoppers should prioritise communicating value through price-quality alignment and promotional clarity rather than investing heavily in brand narrative or sustainability messaging at point of purchase.