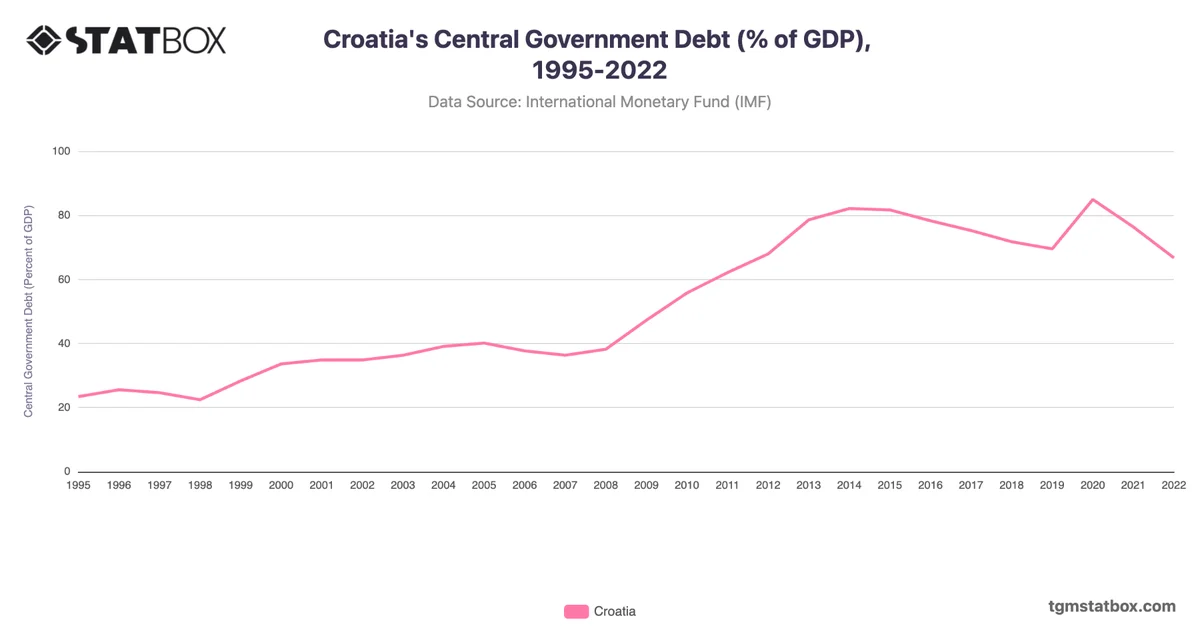
Croatia’s government debt began at a relatively moderate level in 1998, at 23.2%, but increased sharply in the early 2000s, reaching 41.8% by 2005 as the country invested in infrastructure and other development projects. After 2008, the debt continued to rise, reaching 63.4% in 2011 and peaking at 82.4% in 2014, largely due to the impacts of the global financial crisis and the eurozone debt crisis, which affected Croatia’s export markets and economic growth.
Following the 2014 peak, Croatia began to reduce its debt-to-GDP ratio, aided by economic recovery and fiscal consolidation efforts, with debt declining to 71.9% by 2019. However, the COVID-19 pandemic reversed this trend, pushing debt to 86.8% in 2020. By 2022, Croatia’s debt ratio had fallen to 67.5%, reflecting a recovery from the pandemic’s impact and emphasizing the importance of fiscal sustainability in maintaining economic resilience.
Following the 2014 peak, Croatia began to reduce its debt-to-GDP ratio, aided by economic recovery and fiscal consolidation efforts, with debt declining to 71.9% by 2019. However, the COVID-19 pandemic reversed this trend, pushing debt to 86.8% in 2020. By 2022, Croatia’s debt ratio had fallen to 67.5%, reflecting a recovery from the pandemic’s impact and emphasizing the importance of fiscal sustainability in maintaining economic resilience.
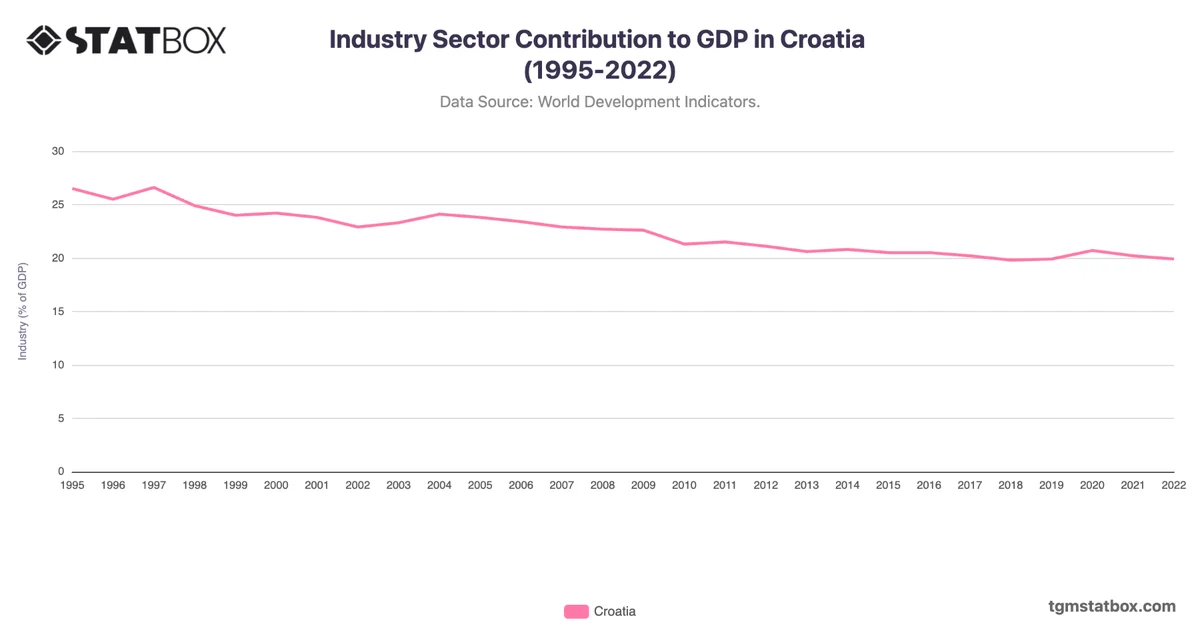
For additional information, visit statistics on Croatia’s net lending/borrowing as percentage of GDP, Croatia’s industry sector share in GDP, Croatia’s central government debt level.