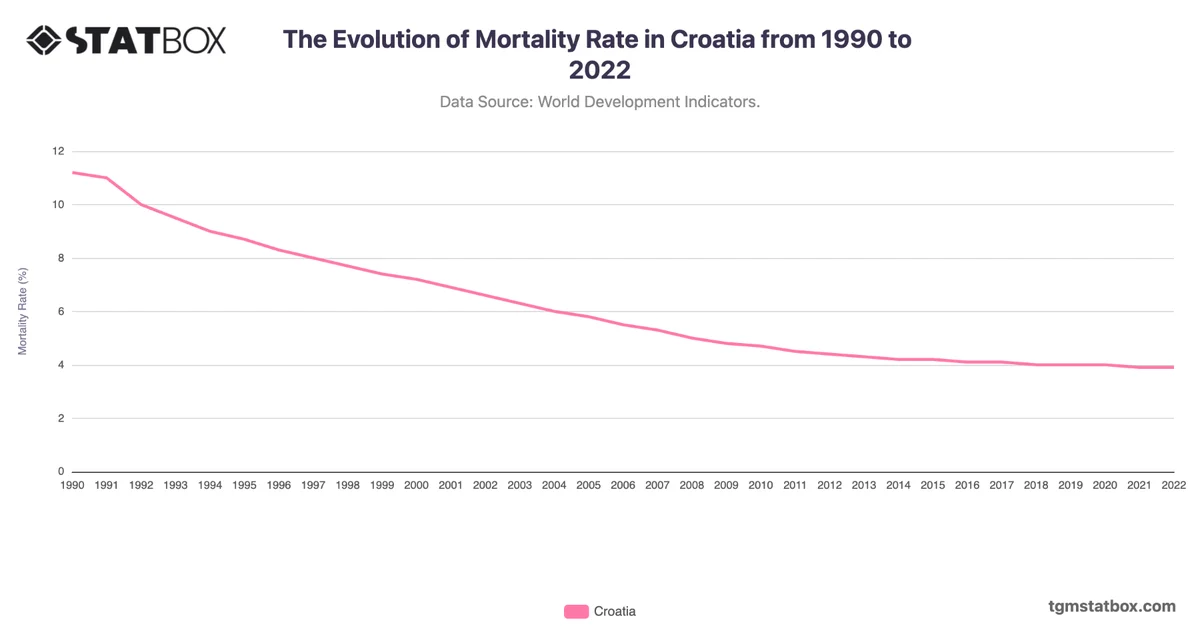
Croatia's death rate exhibited relative stability in the 1990s, fluctuating between 10.6 and 11.7. The early increase in 1991 coincides with the Croatian War of Independence, which strained healthcare infrastructure and directly impacted mortality rates. Post-war recovery saw the rate stabilize through the early 2000s.
From 2012 onwards, a gradual rise is noted, peaking at 16.2 in 2021, largely driven by an aging population and the COVID-19 pandemic. Croatia's demographic shift toward an older population is evident in the consistent increases during the 2010s. The decline to 14.8 in 2022 suggests improvements post-pandemic, though the long-term challenge of an aging population remains.
From 2012 onwards, a gradual rise is noted, peaking at 16.2 in 2021, largely driven by an aging population and the COVID-19 pandemic. Croatia's demographic shift toward an older population is evident in the consistent increases during the 2010s. The decline to 14.8 in 2022 suggests improvements post-pandemic, though the long-term challenge of an aging population remains.
For a deeper dive into the topic, explore Croatia’s annual GDP growth rate, Croatia’s military personnel share, Croatia's population trends.