Croatia’s central government debt as a percentage of GDP exhibited substantial fluctuations between 1990 and 2022. During the late 1990s, the debt ratio was relatively low, declining from 23.4% in 1995 to 22.43% in 1998. However, a notable rise occurred post-1999, coinciding with the economic challenges of transitioning from a war-impacted economy, pushing the debt to 33.61% by 2000.
A significant escalation took place during the global financial crisis of 2008-2009, with the debt climbing sharply from 38.19% in 2008 to 47.26% in 2009, and continuing to rise throughout the 2010s, peaking at 82.1% in 2014. The country’s EU accession in 2013 likely influenced reforms that enabled a gradual reduction in debt levels. By 2019, the debt stood at 69.51%, only to spike again in 2020 due to pandemic-related expenditures, reaching 84.91%. As of 2022, Croatia’s debt ratio decreased significantly to 66.69%, reflecting strong economic recovery and fiscal discipline.
A significant escalation took place during the global financial crisis of 2008-2009, with the debt climbing sharply from 38.19% in 2008 to 47.26% in 2009, and continuing to rise throughout the 2010s, peaking at 82.1% in 2014. The country’s EU accession in 2013 likely influenced reforms that enabled a gradual reduction in debt levels. By 2019, the debt stood at 69.51%, only to spike again in 2020 due to pandemic-related expenditures, reaching 84.91%. As of 2022, Croatia’s debt ratio decreased significantly to 66.69%, reflecting strong economic recovery and fiscal discipline.
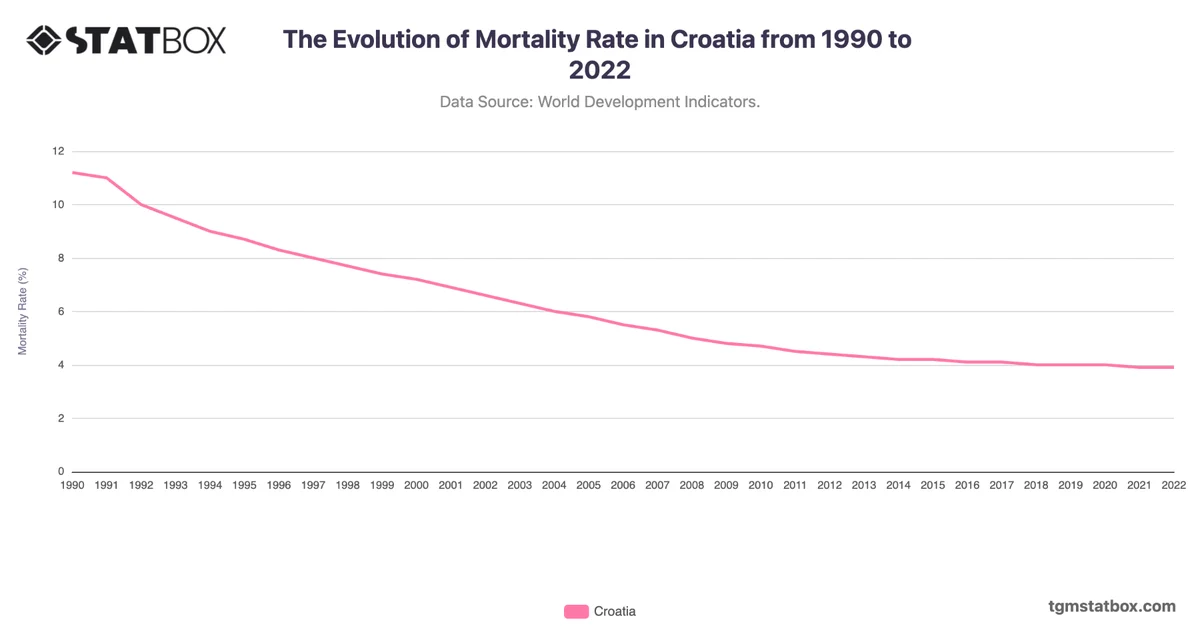
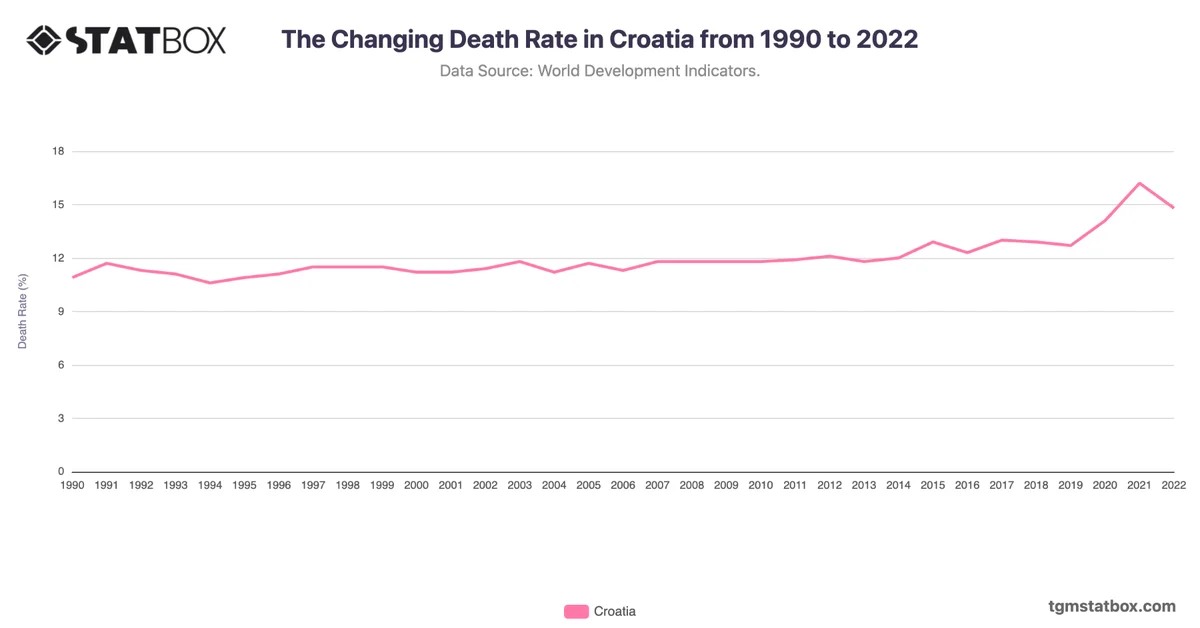
Explore related charts to gain a better understanding of Croatia’s annual GDP figures, Croatia’s death rate fluctuations, Croatia’s net lending/borrowing as percentage of GDP.