Ethiopia's fertility rate saw a dramatic decline over the three decades, dropping from 7.2 children per woman in 1990 to 4.1 in 2022. The steepest declines occurred between 1995 and 2010, a period marked by improved access to healthcare, family planning, and education for women. These developments, alongside urbanization, significantly reduced fertility rates across the country.
The trend stabilized somewhat after 2015, with rates declining more gradually from 4.5 in 2016 to 4.1 in 2022. This slowing pace suggests that while modernization continues, traditional norms and rural demographics still sustain higher fertility compared to global averages.
The trend stabilized somewhat after 2015, with rates declining more gradually from 4.5 in 2016 to 4.1 in 2022. This slowing pace suggests that while modernization continues, traditional norms and rural demographics still sustain higher fertility compared to global averages.
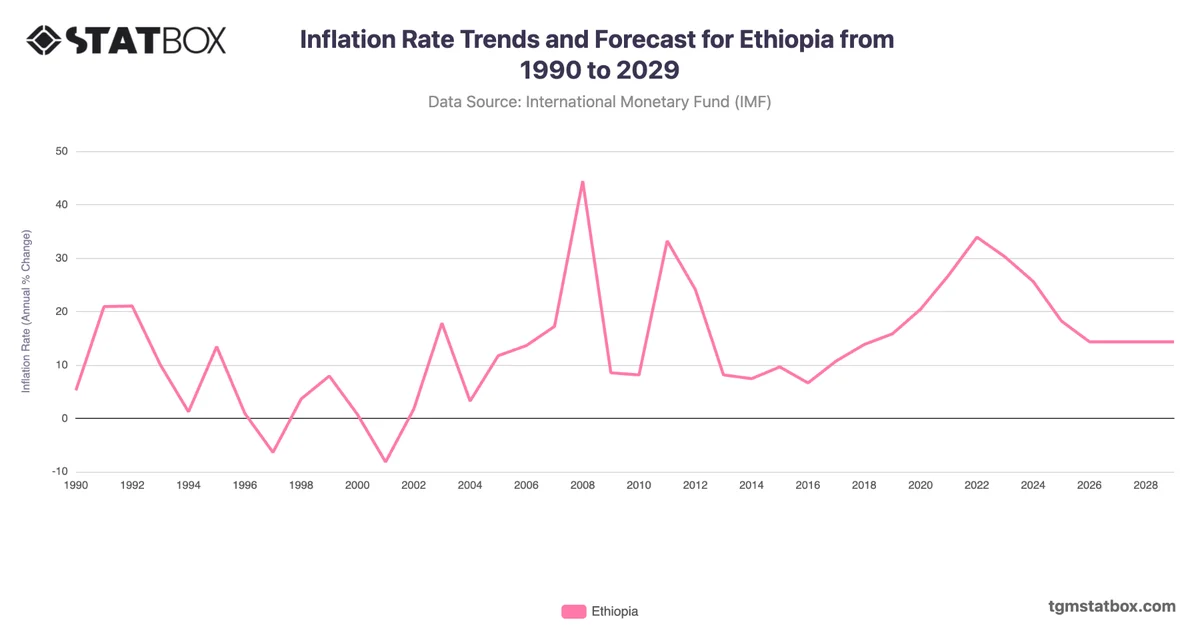
Explore related charts to gain a better understanding of Ethiopia’s urban growth, Ethiopia’s inflation rate trajectory, Ethiopia’s population numbers.