Share the statistic on social media channels or embed the statistic in your website using "Embed Code", where available.
Share chart
Embed chart Embed copied!Cite this statistic and select one of the following formats: APA, Chicago, Harvard, MLA & Bluebook
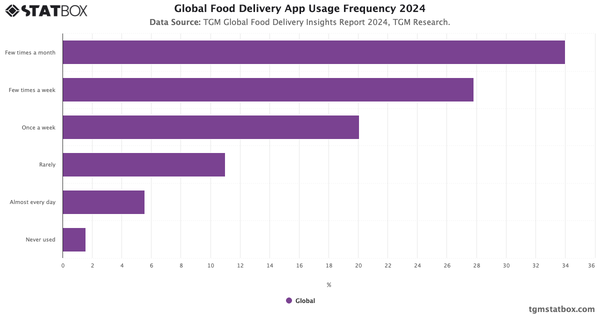
"How often do you use food delivery app?"
Key Takeaways
In India, food delivery apps are a regular part of life for many, with a combined 63% of respondents using them at least once a week. Some order once or a few times a week—or even daily—driven by reasons like avoiding cooking or seeking late-night dining options. Others use food delivery apps less often, with 29.9% ordering just a few times a month—for example, when there's a special occasion or they’re craving a particular dish.

Food Delivery Insights Report in India
Discover insights into Food Delivery in India with TGM StatBox. Access our detailed report, including graphs and tables, to uncover the industry's trends.
Go to report


Connect with our expert team for immediate assistance or comprehensive market analysis. We are always ready to support your business needs.