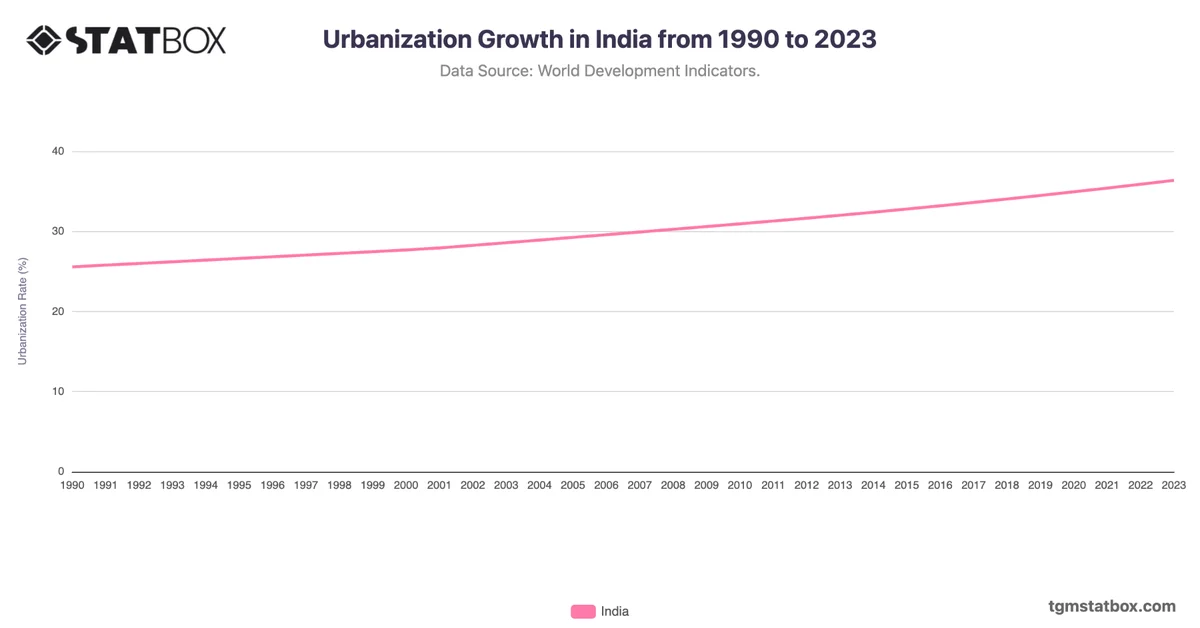
India experienced a significant drop in fertility rates from 4.0 in 1990 to 2.0 in 2022, marking a 50% decline. This reduction reflects the impact of widespread family planning programs initiated in the 1970s, coupled with improving literacy rates and urbanization. Economic transitions and increasing healthcare access further facilitated this change.
From 2005 onward, fertility rates stabilized near replacement levels, influenced by persistent rural-urban divides and socio-cultural factors. The shift highlights India’s journey toward demographic stabilization, though regional disparities in fertility rates persist.
From 2005 onward, fertility rates stabilized near replacement levels, influenced by persistent rural-urban divides and socio-cultural factors. The shift highlights India’s journey toward demographic stabilization, though regional disparities in fertility rates persist.
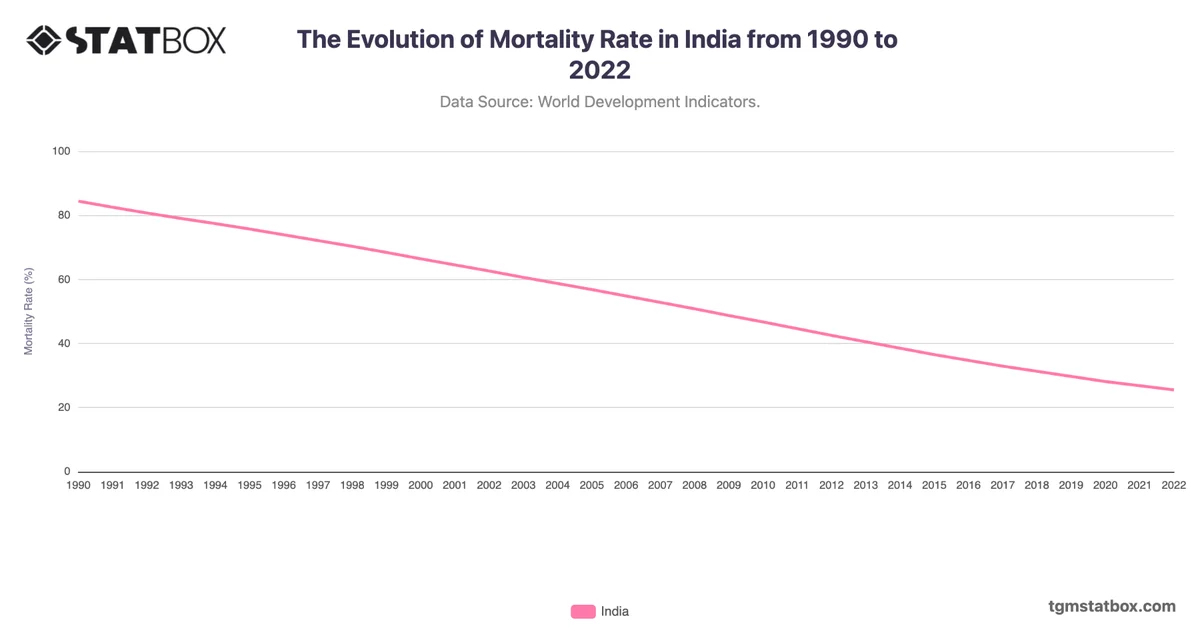
Discover additional trends and data on India’s population density, India’s mortality rate trends, India’s population growth rates.