Chart

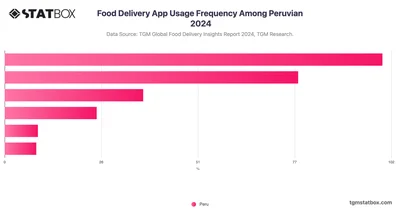
Food Delivery App Usage Frequency Among Peruvian 2024

Log in to unlock

No account? Sign up free — new members get 3 premium charts to view.

Insights

Key Takeaways

In Peru, food delivery apps are becoming woven into the rhythm of everyday life—not just as an occasional indulgence, but as a practical tool for managing time and daily routines. Nearly half of users () order food at least once a week. This trend signals a broader shift in lifestyle, where the convenience of digital ordering is increasingly viewed as a normal, reliable option. While the largest group () uses these services a few times per month, their behavior still reflects a steady reliance on delivery when cooking feels inconvenient or time is short.

AI-powered chart insight: This summary is automatically generated to help you understand the chart at a glance. It is intended as an overview; view the full chart and underlying data for complete context.

Related report

Would You Like to Know More?
Explore Our Food Delivery Report

Charts library

Further Recommended Food Delivery Statistics

Statbox vector
The briefing
New data, in your inbox

Consumer insights, data stories and product updates as we publish them. No other mail, and one click to leave.

Roughly two emails a month.

Research services
Have a question our newsroom hasn't answered? Ask it directly.

Our team can run the study behind the story — in 60+ countries, on your question, with the data belonging to you.