France's GDP demonstrates steady growth, reflecting its role as a major global economy. From $67.4 billion in 1961, GDP surged during the 1970s, reaching $701 billion in 1980, driven by industrialization and modernization. The 1990s showed further expansion, with GDP exceeding $1.6 trillion by 1995.
The 2008 financial crisis caused a temporary contraction, but France recovered, with GDP reaching $3.03 trillion in 2023. A strong focus on technology, luxury goods, and agriculture has sustained France’s growth despite global economic uncertainties.
The 2008 financial crisis caused a temporary contraction, but France recovered, with GDP reaching $3.03 trillion in 2023. A strong focus on technology, luxury goods, and agriculture has sustained France’s growth despite global economic uncertainties.
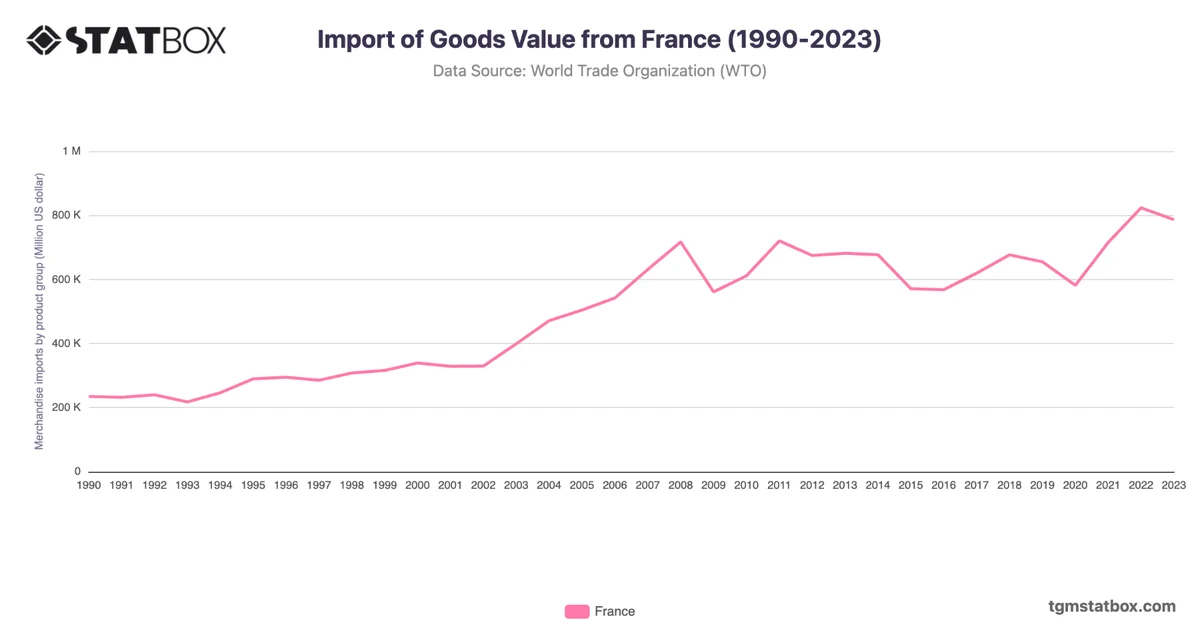
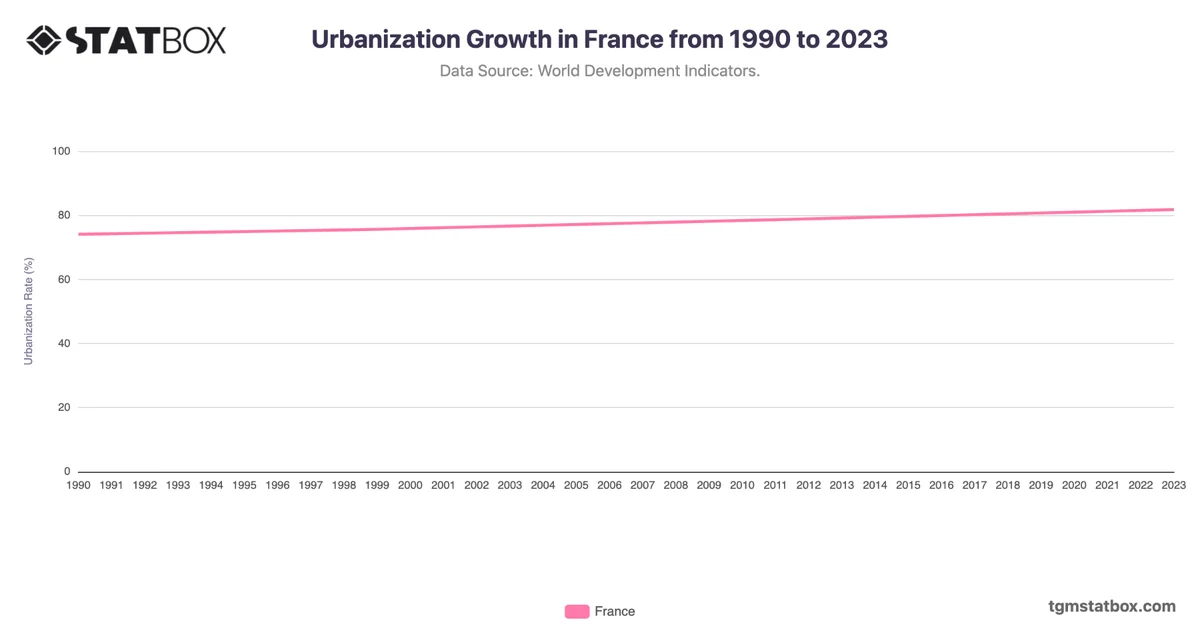
Gain a broader perspective by reviewing France’s goods import value, France’s population figures, urbanization rate in France.