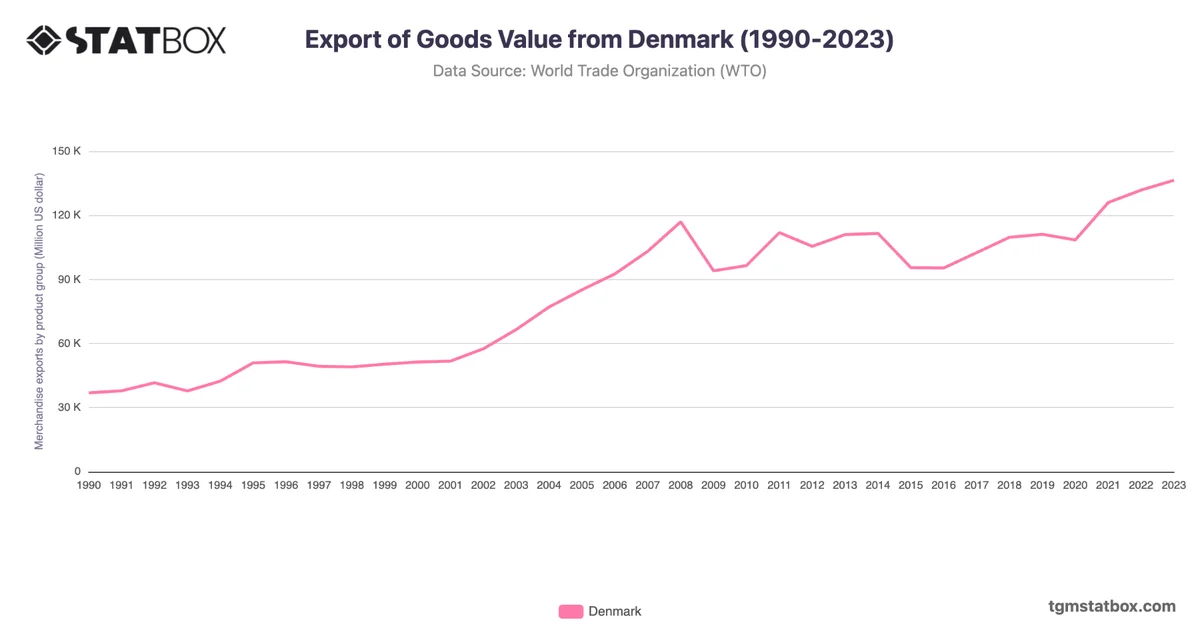
Denmark's import value increased from $33.3B in 1990 to $126B in 2023, reflecting its position as a developed and export-driven economy. Steady growth through the 1990s and early 2000s highlights rising consumer demand and industrial expansion, with a significant jump from $68B in 2004 to $109B in 2008 due to a booming global economy.
The financial crisis of 2009 caused a drop to $83.1B, but imports rebounded to $128.3B by 2022, driven by renewable energy investments and robust demand for technology and consumer goods. Denmark's consistent growth trajectory underscores its resilience and adaptability within the EU and global trade networks.
The financial crisis of 2009 caused a drop to $83.1B, but imports rebounded to $128.3B by 2022, driven by renewable energy investments and robust demand for technology and consumer goods. Denmark's consistent growth trajectory underscores its resilience and adaptability within the EU and global trade networks.
Discover additional trends and data on Denmark’s services sector share in GDP, Denmark’s annual GDP data, Denmark’s population growth trend.