The chart shows the trends in Gambia’s working-age population (ages 15 to 64) from 1990 to 2022. In 1990, 50.8% of the population fell within the working-age category, and this proportion gradually increased to 54.5% by 2022.
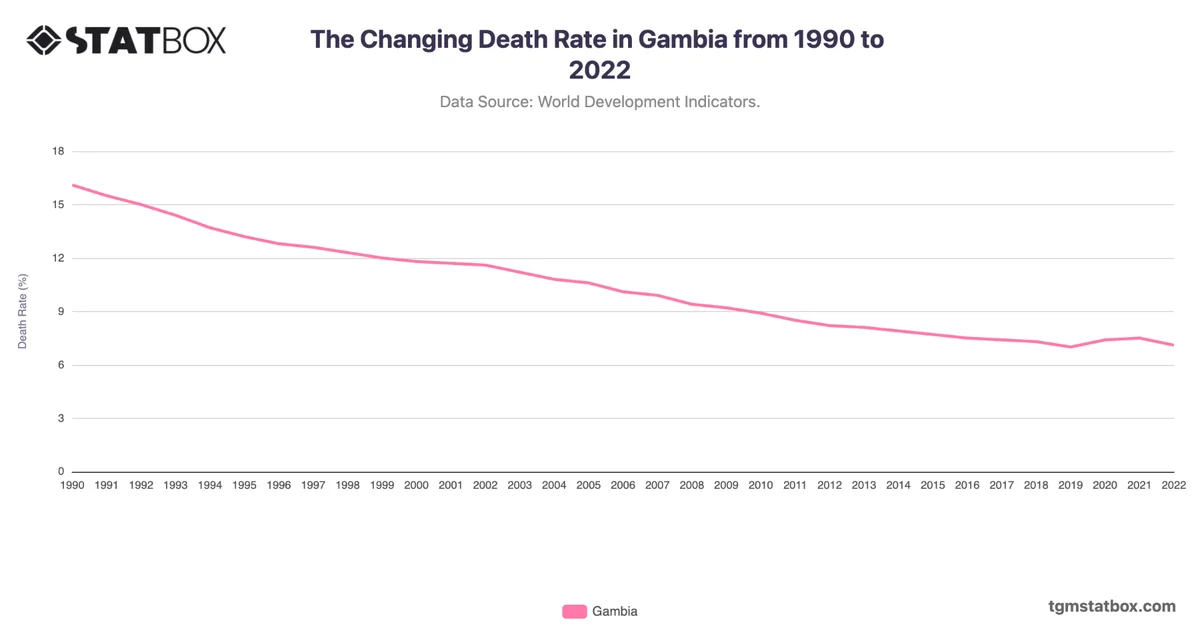
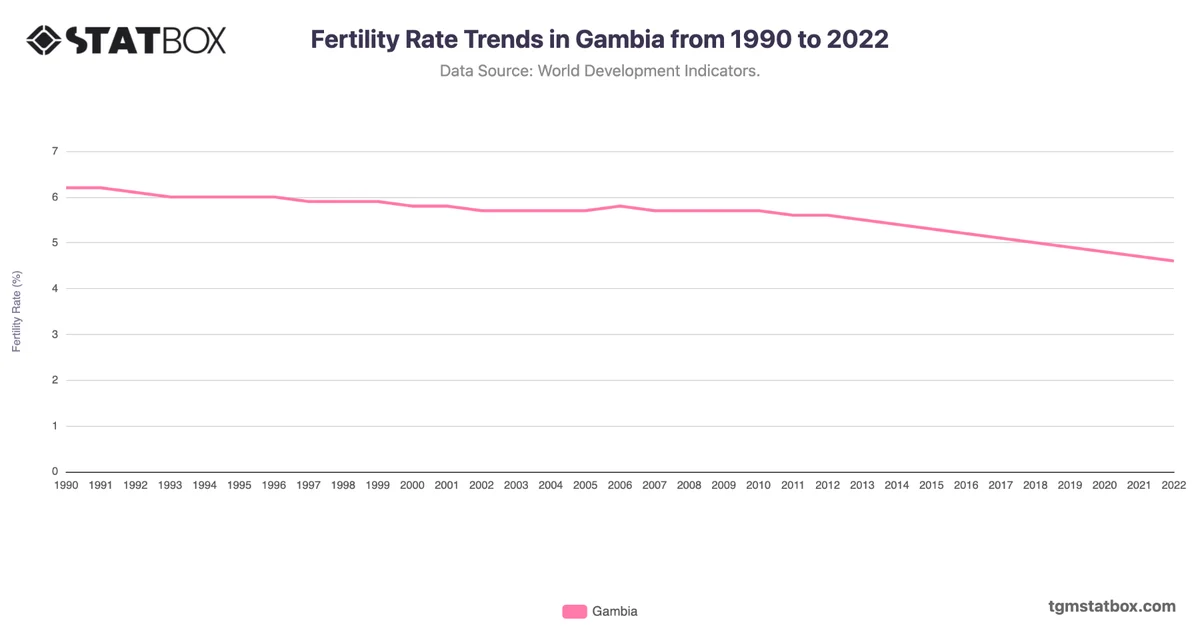
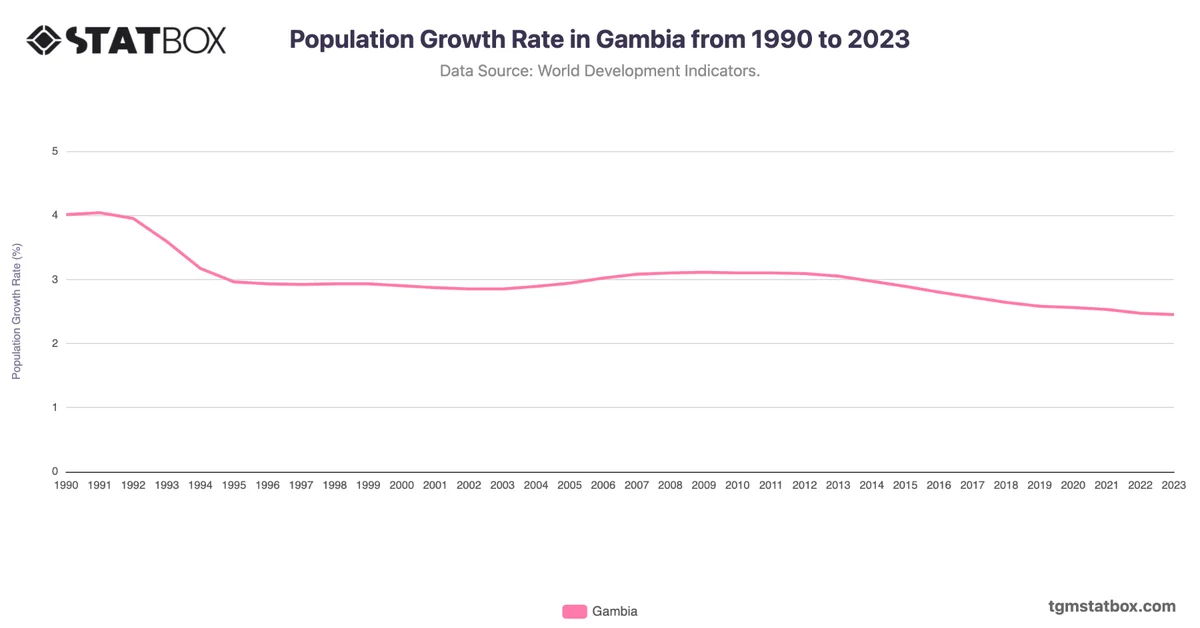
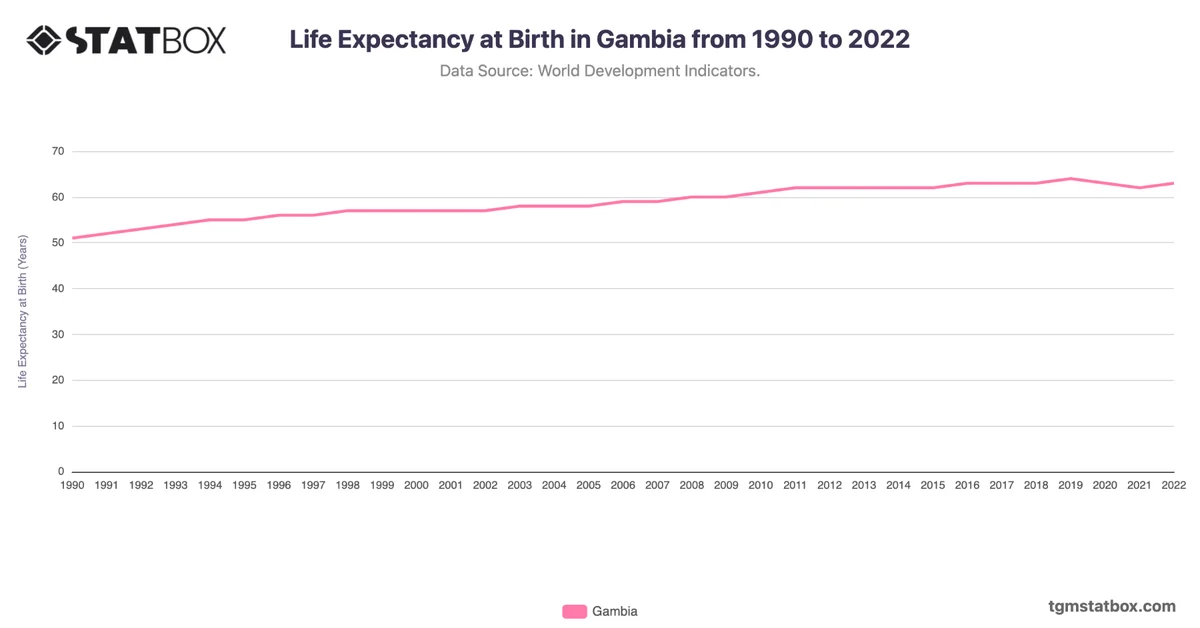
This steady rise indicates demographic changes driven by factors such as improved healthcare, higher life expectancy, and a gradual decline in birth rates. The increasing share of the working-age population suggests that Gambia has a growing labor force, which could contribute to economic productivity.
This steady rise indicates demographic changes driven by factors such as improved healthcare, higher life expectancy, and a gradual decline in birth rates. The increasing share of the working-age population suggests that Gambia has a growing labor force, which could contribute to economic productivity.
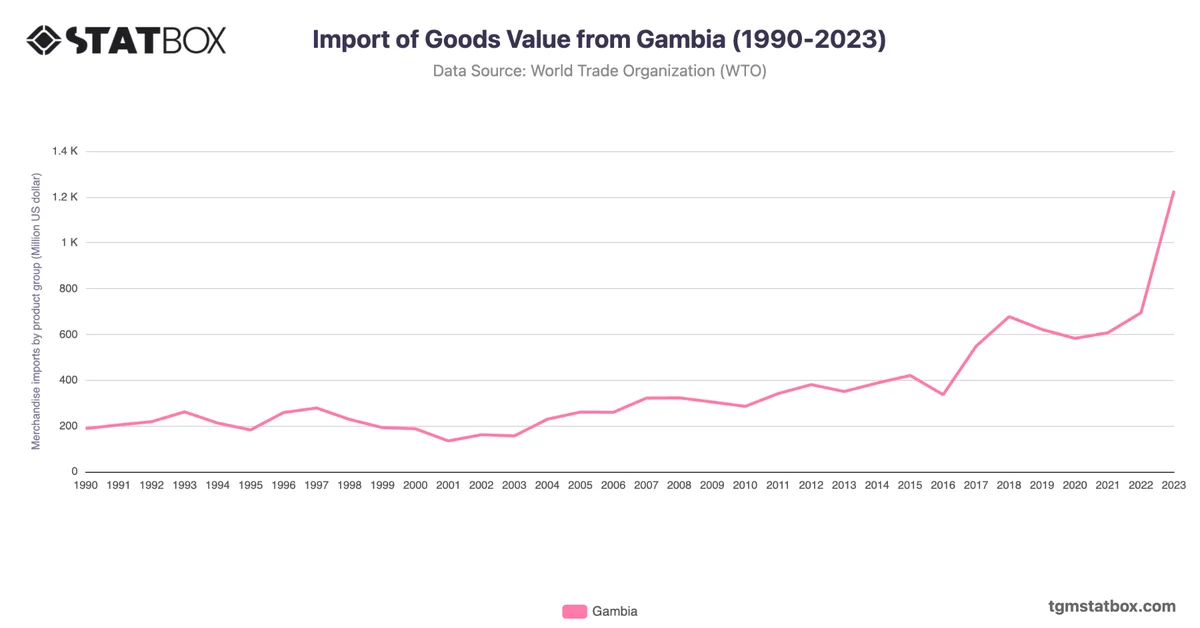
For additional information, visit statistics on Gambia’s import value, Gambia’s services sector GDP share, Gambia’s population growth rate.