Germany’s GDP highlights its position as Europe’s largest economy, underpinned by industrial might and exports. Starting at $96.2 billion in 1961, GDP grew significantly during the post-war Wirtschaftswunder, reaching $1.4 trillion by 1989. Reunification in 1990 further boosted growth, with GDP surpassing $2.2 trillion in 1992.
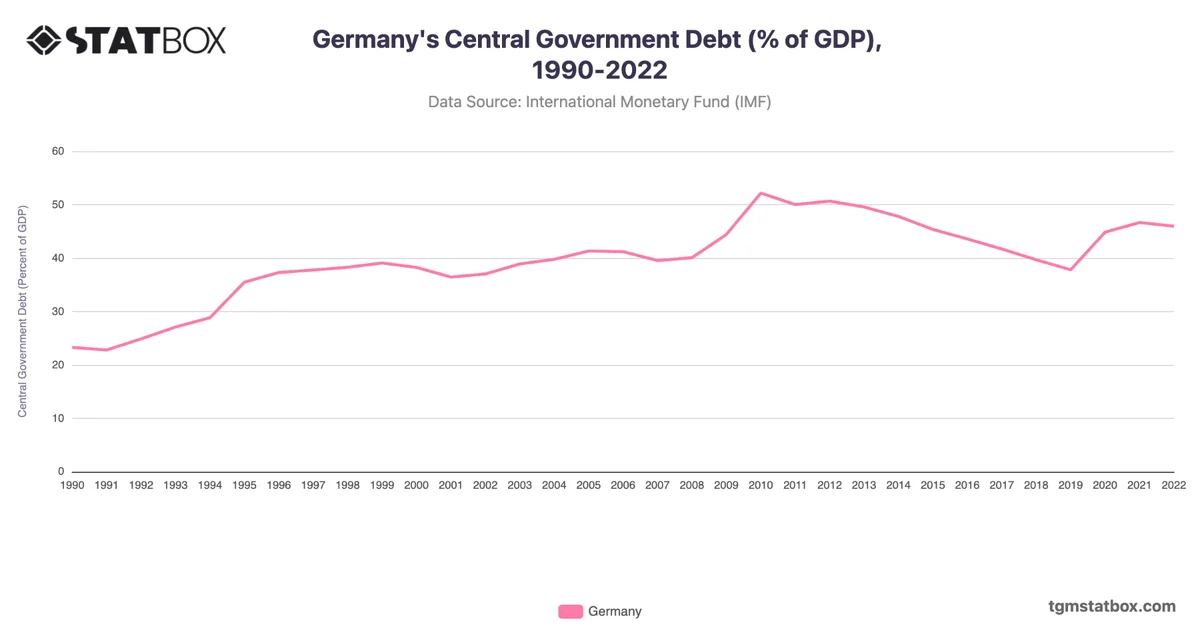
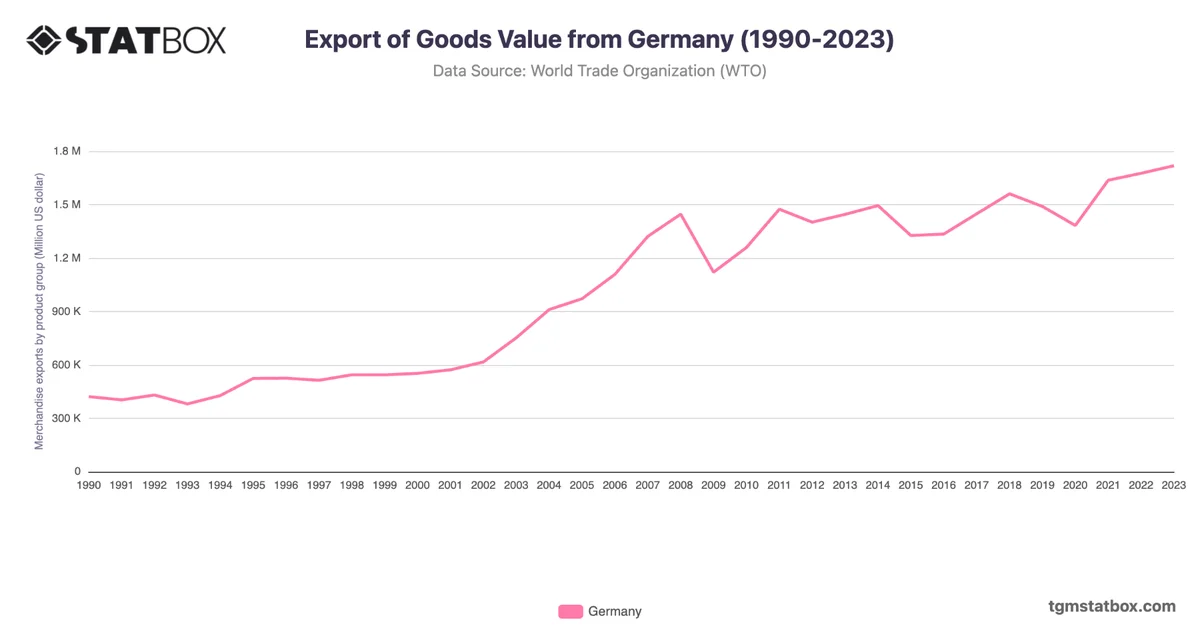
The global financial crisis in 2008 caused a contraction, but Germany’s strong fiscal policies and export resilience led to recovery, with GDP exceeding $4.4 trillion in 2023. Its focus on automotive, machinery, and green energy ensures sustained economic leadership despite global challenges.
The global financial crisis in 2008 caused a contraction, but Germany’s strong fiscal policies and export resilience led to recovery, with GDP exceeding $4.4 trillion in 2023. Its focus on automotive, machinery, and green energy ensures sustained economic leadership despite global challenges.
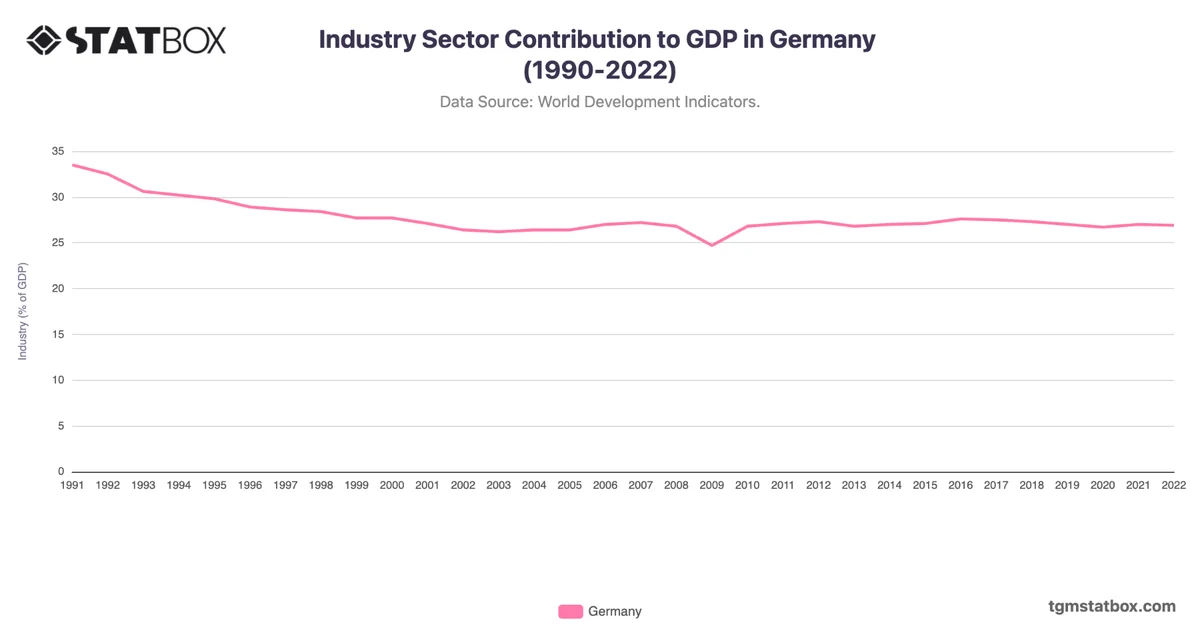
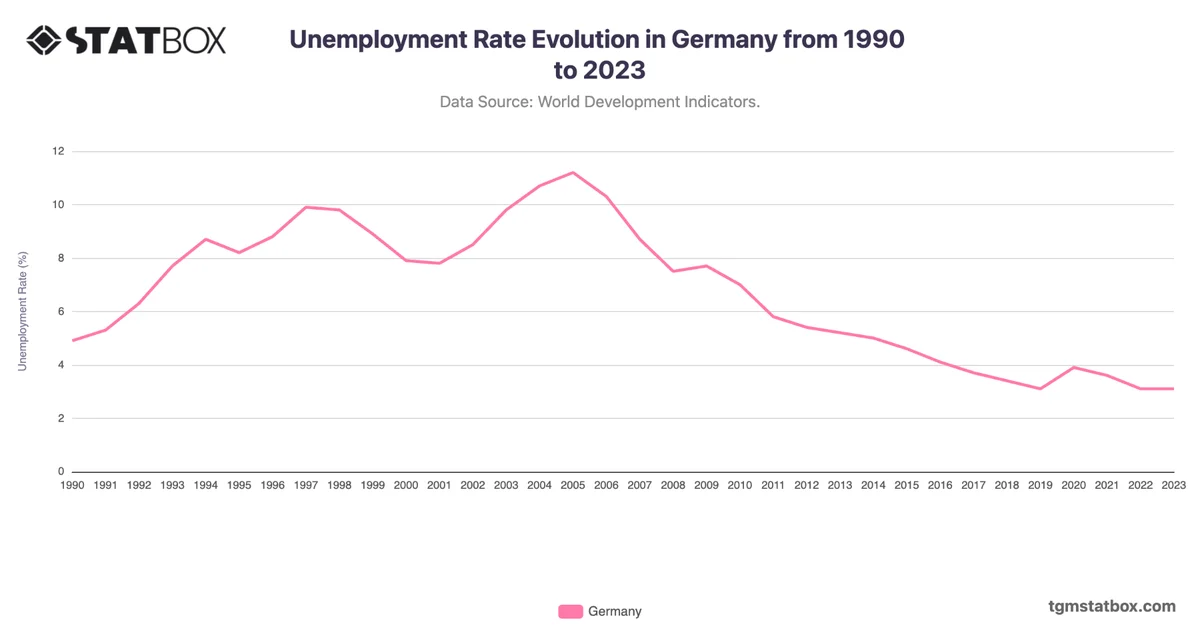
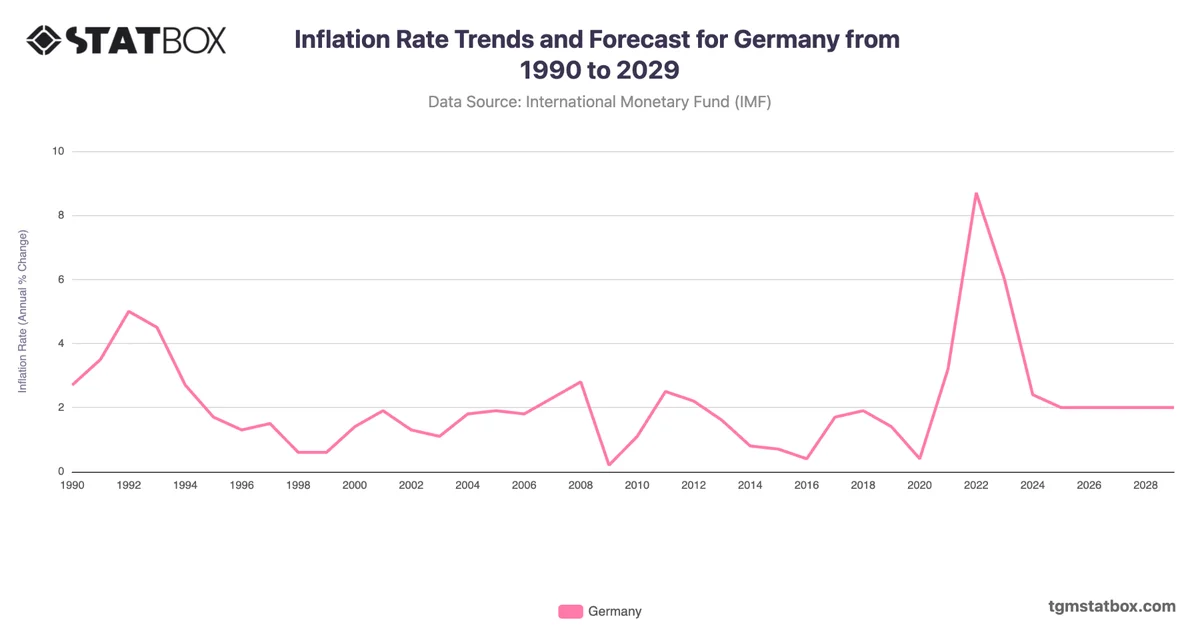
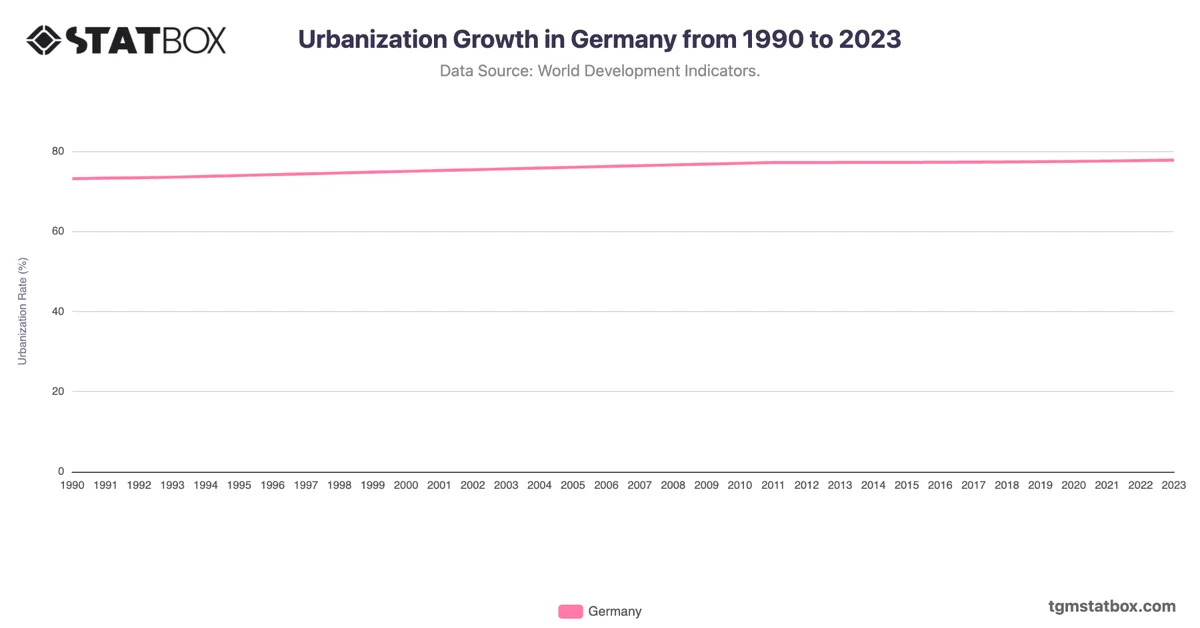
Explore related charts to gain a better understanding of Germany’s industry sector’s GDP contribution, Germany’s net lending/borrowing share in GDP, Germany’s services sector GDP share in Germany.