Germany's central government debt as a percentage of GDP exhibited a steady rise from 1990, starting at 23.25%, to a peak of 52.14% in 2010. This trend was influenced by economic unification following the fall of the Berlin Wall, increasing fiscal demands. The 2009 financial crisis significantly contributed to this spike due to stimulus spending and reduced revenues.
From 2010 onwards, debt levels began to decline, reaching 37.79% by 2019, reflecting fiscal consolidation and economic growth. However, the COVID-19 pandemic reversed this trend temporarily, with debt rising to 46.64% in 2021 before stabilizing at 45.95% in 2022.
From 2010 onwards, debt levels began to decline, reaching 37.79% by 2019, reflecting fiscal consolidation and economic growth. However, the COVID-19 pandemic reversed this trend temporarily, with debt rising to 46.64% in 2021 before stabilizing at 45.95% in 2022.
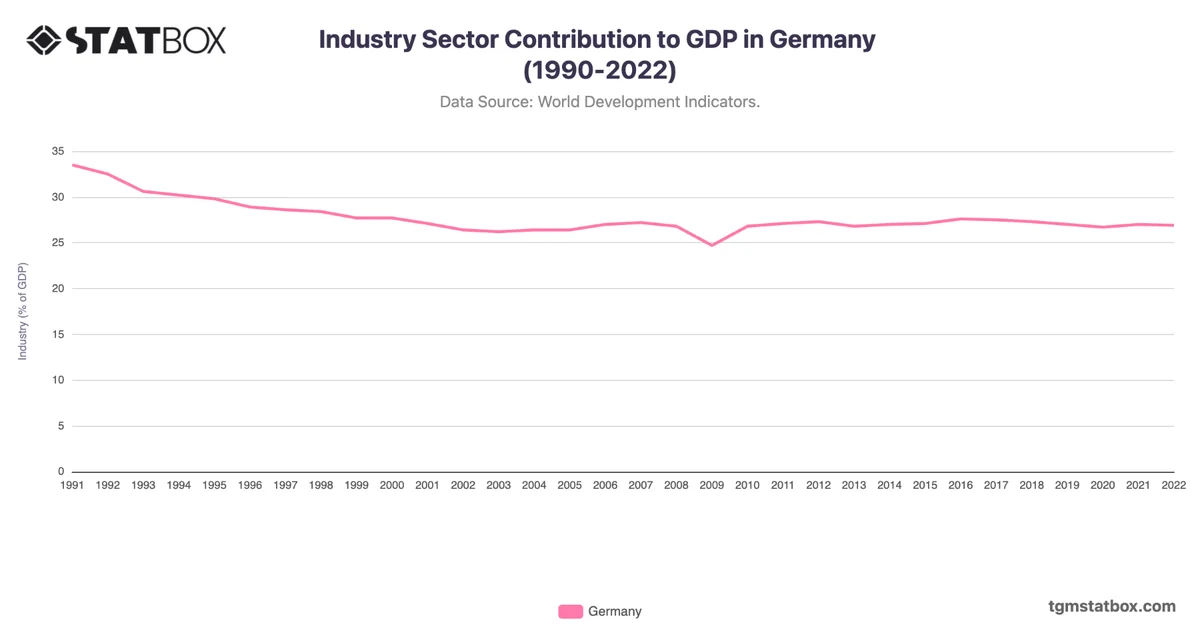
For a deeper dive into the topic, explore Germany’s industry sector’s GDP contribution, Agriculture’s share in Germany’s GDP, Germany’s population density.