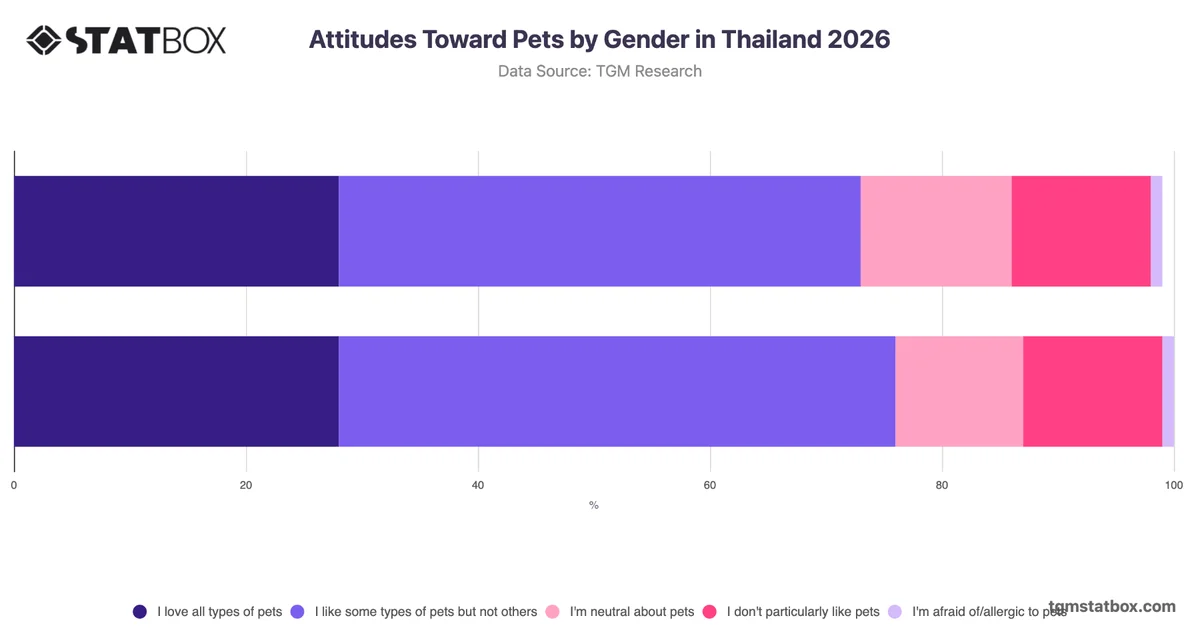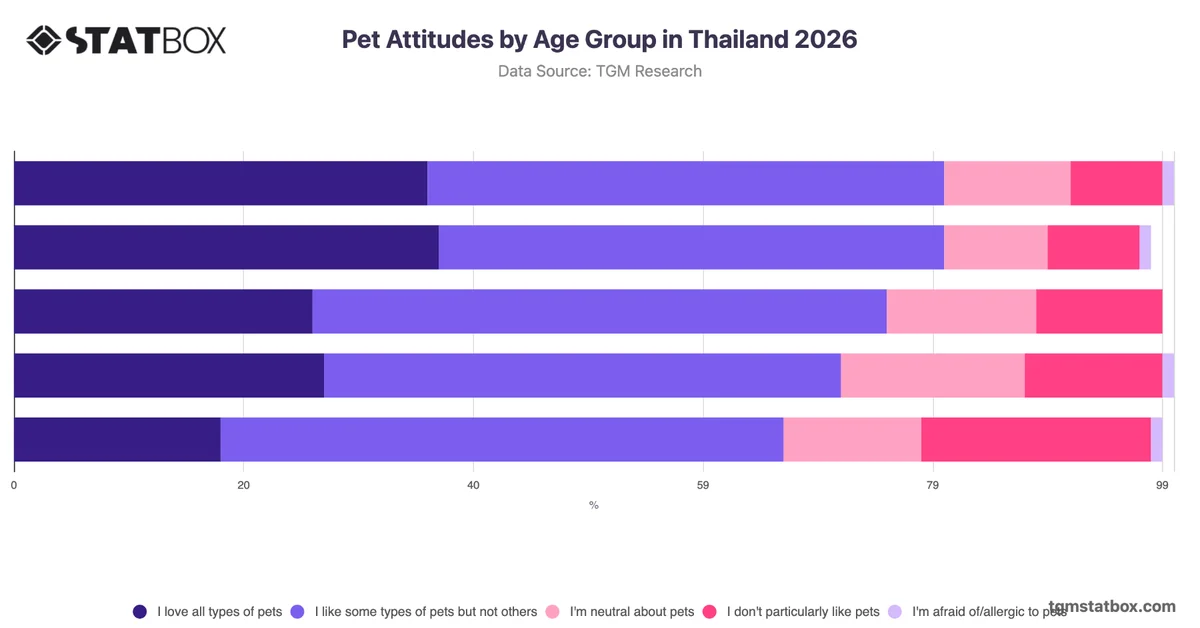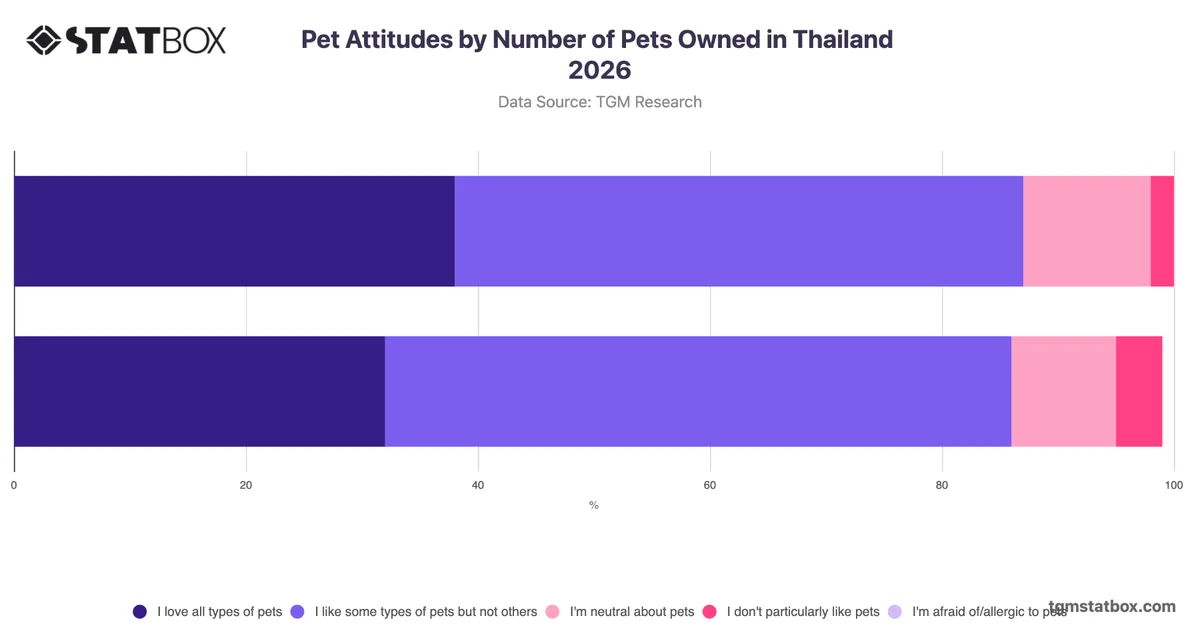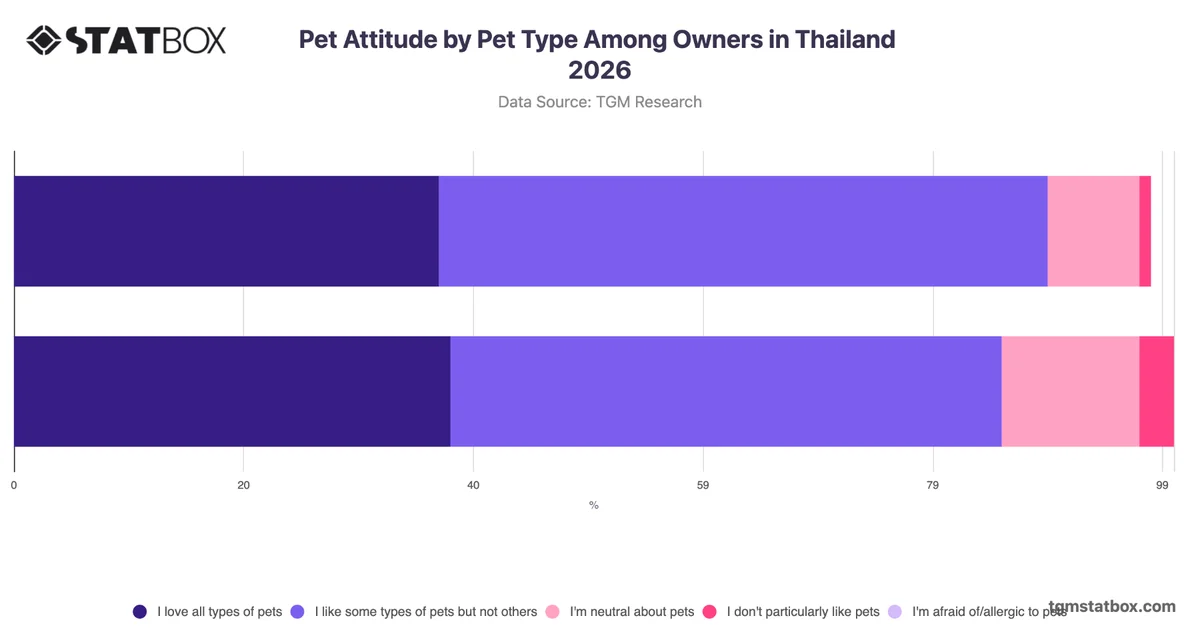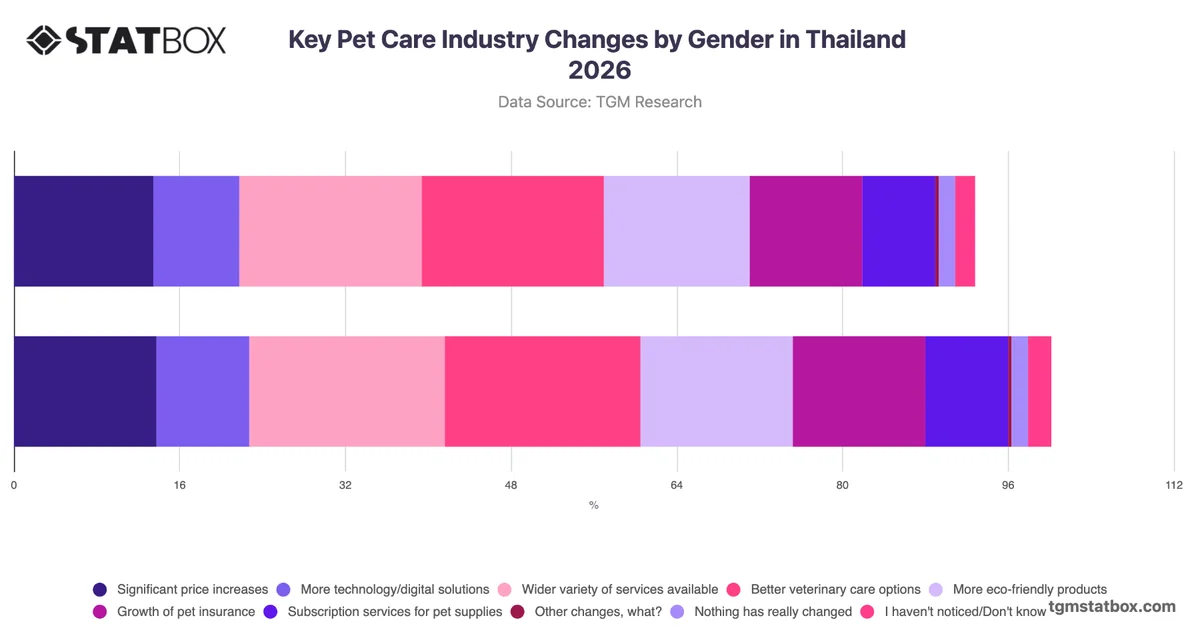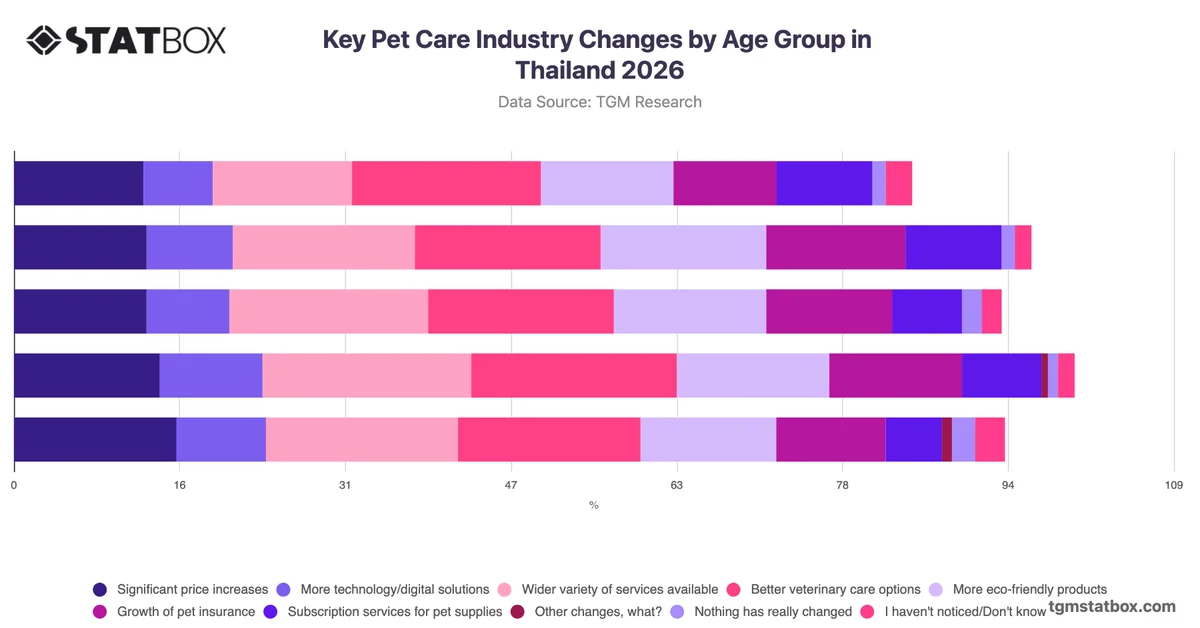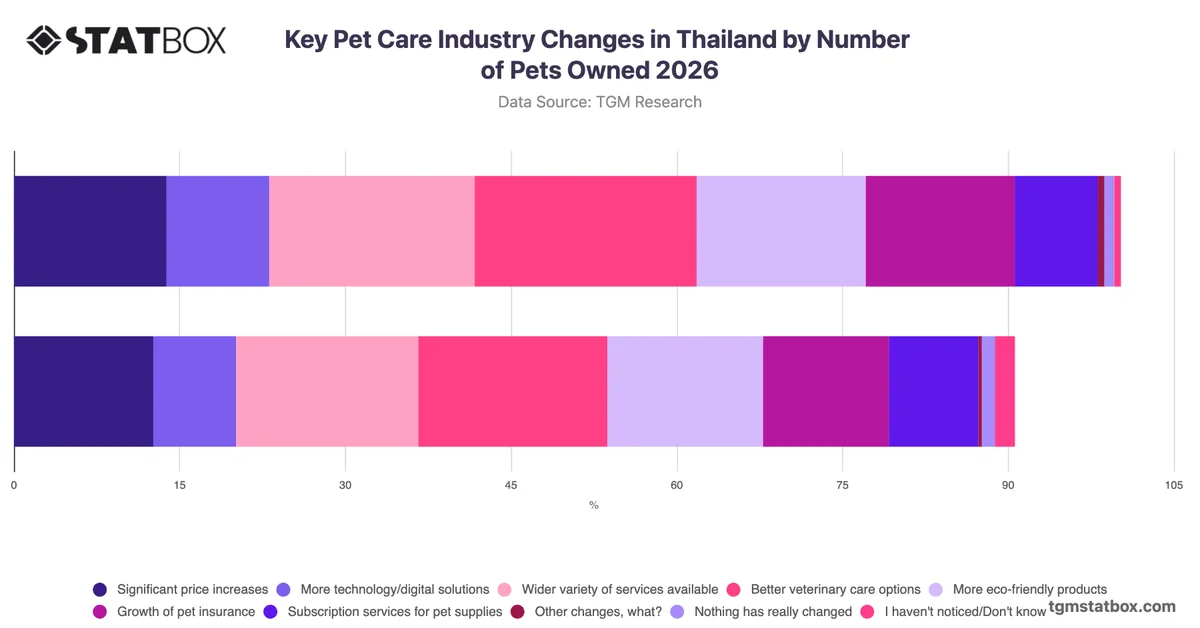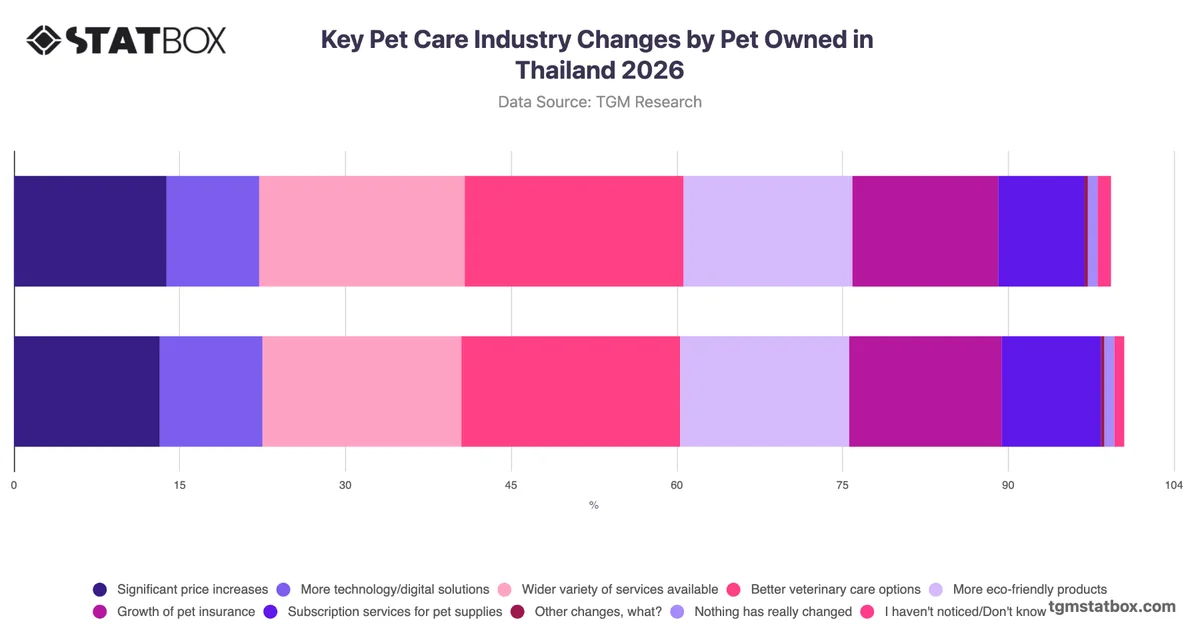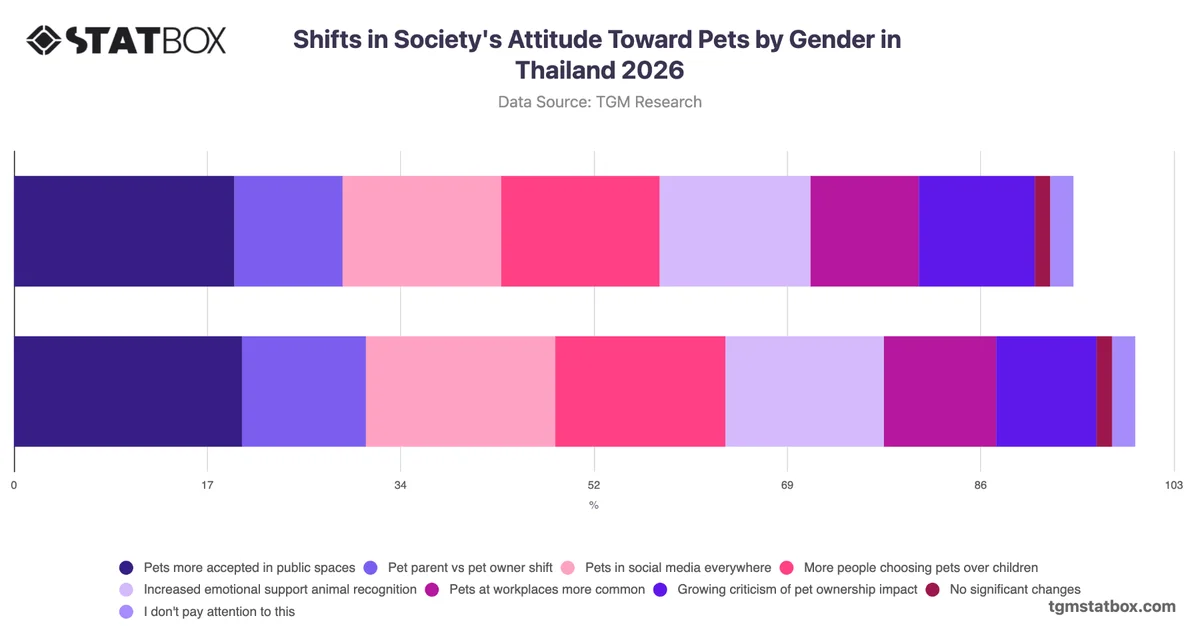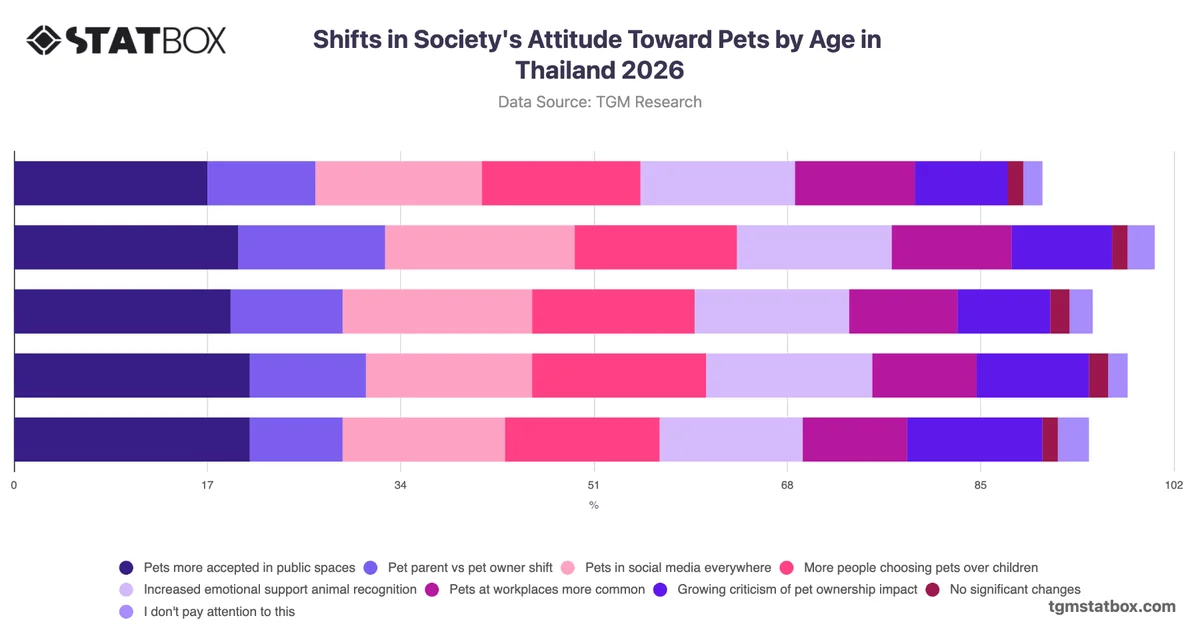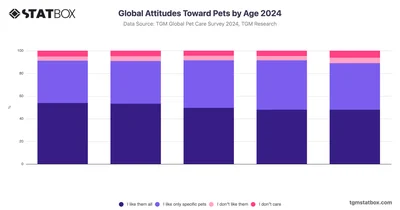
Overall, of males and of females expressed a positive sentiment, stating, “I like them all.” This preference is notably consistent across age groups, with younger adults (18-24 years) showing the highest appreciation at , while older groups (55+ years) demonstrate slightly lower enthusiasm, around . Conversely, a smaller segment of the population, including of males and of females, indicated a preference for “I like only specific pets.” This sentiment varies slightly with age, as younger individuals tend to show a reduced inclination towards specific pet types.
Additionally, only of males and of females reported disliking pets, with the least disdain observed among younger respondents (35-44 years) at approximately . Lastly, attitudes of indifference were also low, with of males and of females stating, “I don’t care".
For additional information, visit statistics on top pet care advice sources, most popular pets worldwide, most popular pet services worldwide.