India's inflation has shown significant fluctuations over the decades, driven by global and domestic economic conditions. The early 1990s saw high inflation, peaking at 13.5% in 1991, largely due to economic liberalization and a balance of payments crisis. Subsequent reforms stabilized inflation, bringing it down to 3.4% in 1999. However, global commodity price shocks in 2008 and 2009 drove inflation back to double digits.
In recent years, inflation stabilized between 4-6%, with a temporary rise to 6.7% in 2022 due to supply chain disruptions and high energy prices. Projections indicate a steady rate of 4.0% by 2027, supported by effective monetary policy and structural reforms.
In recent years, inflation stabilized between 4-6%, with a temporary rise to 6.7% in 2022 due to supply chain disruptions and high energy prices. Projections indicate a steady rate of 4.0% by 2027, supported by effective monetary policy and structural reforms.
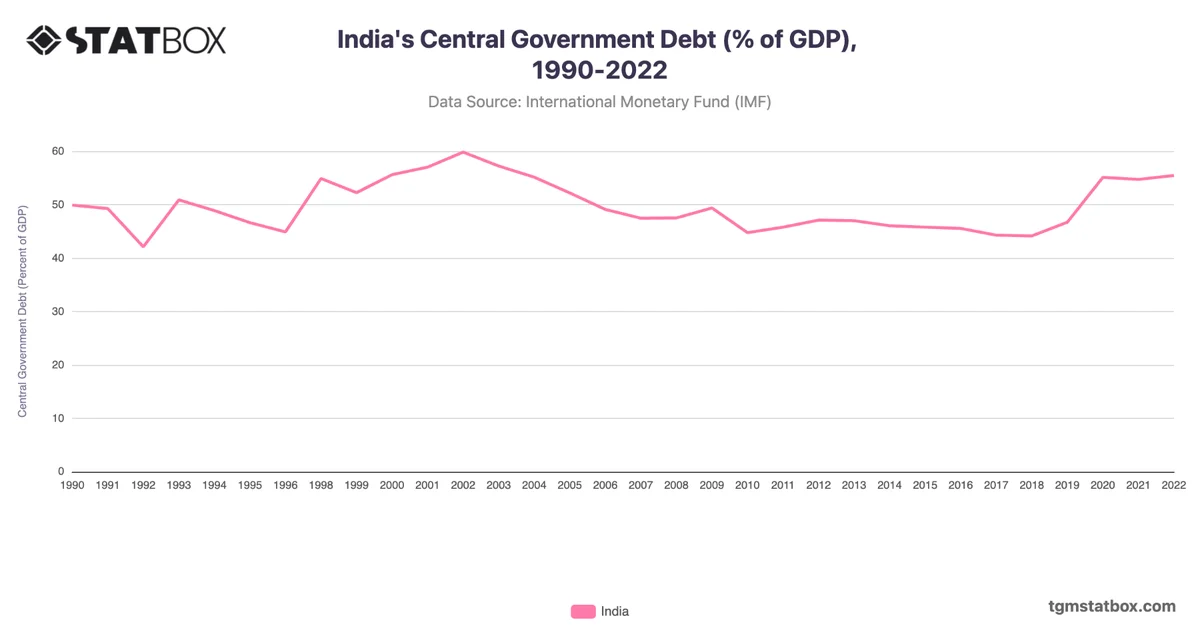
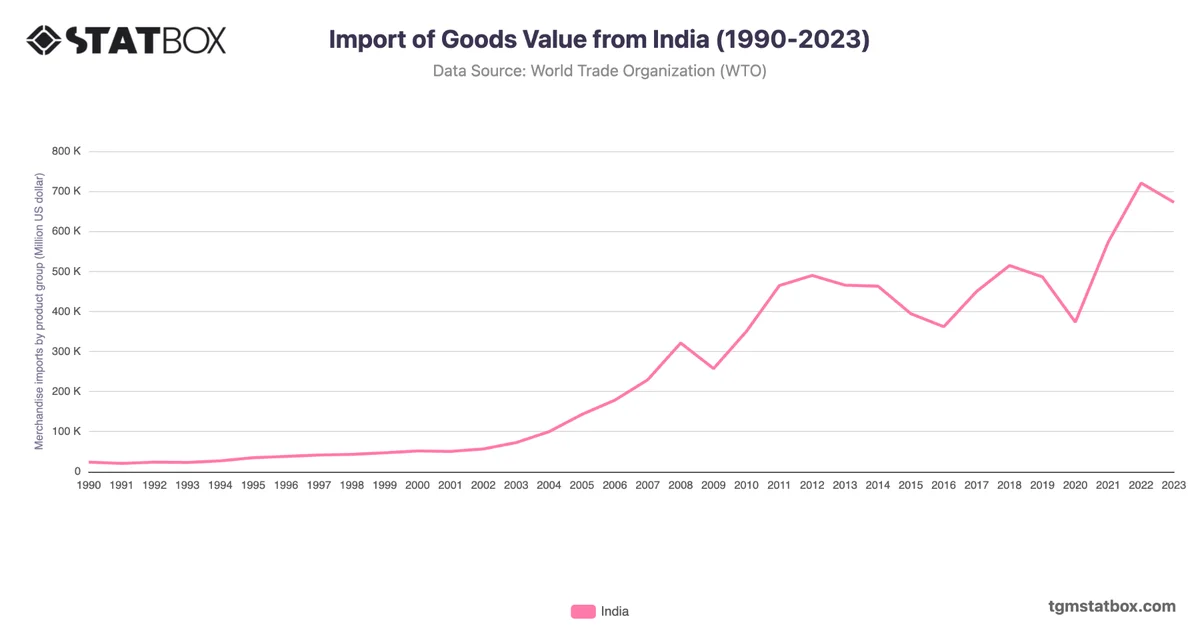
Explore related charts to gain a better understanding of value of goods imported from India, India’s government debt share in GDP, India’s annual GDP data.