The unemployment rate in India showed significant fluctuations from 1994 to 2023, influenced by economic reforms, population growth, and various global events. In 1994, the rate stood at 6.8%, a period marked by the early stages of India's economic liberalization. A notable decline followed, with the rate dropping to 2.7% by 2000 as economic opportunities expanded and more people joined the workforce. However, challenges emerged over the next decade, and by 2010, the unemployment rate stabilized around 3.1%, reflecting a maturing economy but also constraints in job creation relative to rapid population growth.
From 2018 onwards, the unemployment rate rose sharply, reaching 7.7% as structural changes in the economy and rural-to-urban migration created pressure on job markets. The COVID-19 pandemic exacerbated this trend in 2020, with a peak at 7.9% before a gradual recovery began. By 2023, the rate had fallen to 4.2%, indicating improved labor conditions and economic recovery efforts. This reduction highlights both resilience and the challenge of creating stable employment amidst economic transformation and a young workforce eager for sustainable opportunities.
From 2018 onwards, the unemployment rate rose sharply, reaching 7.7% as structural changes in the economy and rural-to-urban migration created pressure on job markets. The COVID-19 pandemic exacerbated this trend in 2020, with a peak at 7.9% before a gradual recovery began. By 2023, the rate had fallen to 4.2%, indicating improved labor conditions and economic recovery efforts. This reduction highlights both resilience and the challenge of creating stable employment amidst economic transformation and a young workforce eager for sustainable opportunities.
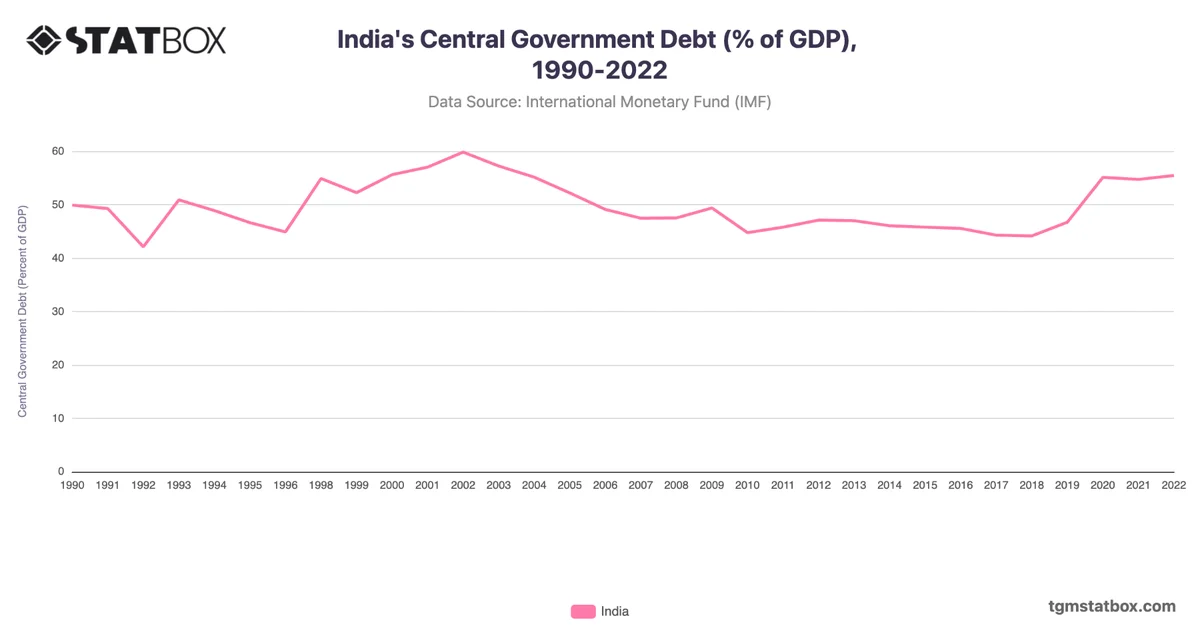
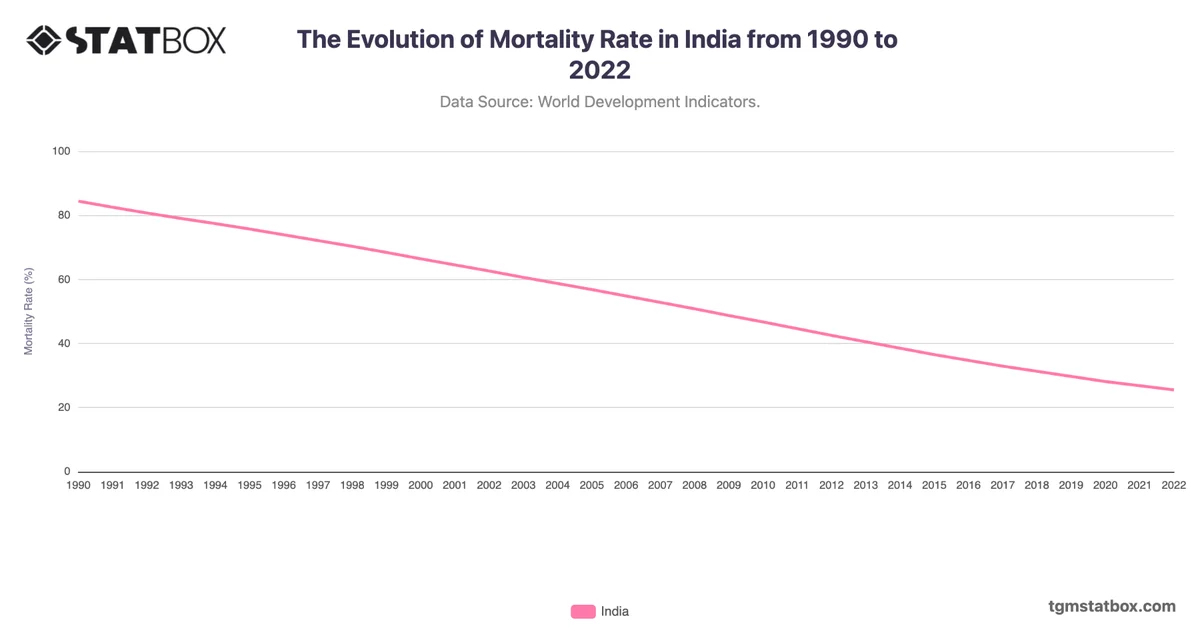
For a deeper dive into the topic, explore India’s mortality rate trends, India’s population growth rates, India’s government debt share in GDP.