Share the statistic on social media channels or embed the statistic in your website using "Embed Code", where available.
Share chart
Embed chart Embed copied!Cite this statistic and select one of the following formats: APA, Chicago, Harvard, MLA & Bluebook
Key Takeaways
Indonesia shows a high preference for mobile devices at 74.21%, indicating a strong trend towards mobile-first engagement. The 24.33% computer usage suggests that while mobile is prevalent, computers remain essential for more complex tasks, including work and education. This combination reflects Indonesia's ongoing efforts to improve digital access and infrastructure for its citizens.
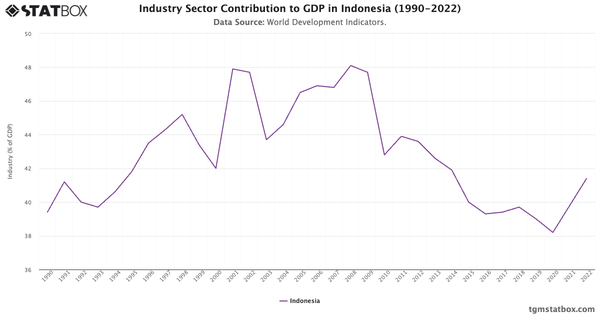
Find out more through related statistics on Indonesia’s population figures, Industry sector’s GDP share in Indonesia, Indonesia’s population growth trends.

Indonesia Sustainability Insights Report 2024
Explore the latest Indonesia insights on sustainability with TGM’s 2024 report series. Access data on behaviors, challenges, and motivations across 30+ markets.
Go to report


Connect with our expert team for immediate assistance or comprehensive market analysis. We are always ready to support your business needs.