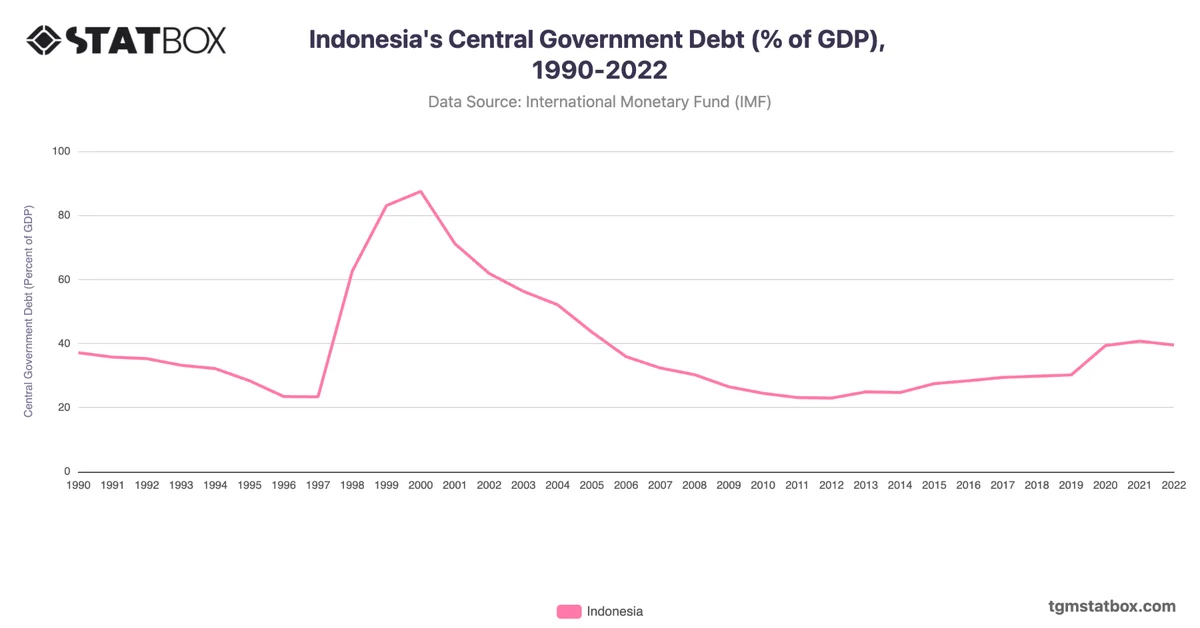
Indonesia’s government debt as a percentage of GDP saw a significant decline from 87.4% in 2000 to 26.5% in 2009. This reduction reflects the economic reforms following the 1997 Asian financial crisis, which included measures to stabilize and grow the economy. By prioritizing fiscal consolidation, Indonesia managed to lower its debt burden significantly, maintaining levels around 30% until 2019. However, the global financial environment shifted in 2020 with the onset of the COVID-19 pandemic, leading debt to increase to 39.7% in 2020 and further to 41.1% in 2021, as government spending rose to support economic recovery efforts.
Following the pandemic, Indonesia showed signs of stabilization, with debt slightly decreasing to 39.9% by 2022. The long-term debt reduction strategy, emphasizing economic resilience and prudent fiscal policies, has positioned Indonesia relatively well compared to other emerging economies. Despite the impact of recent global challenges, Indonesia's debt-to-GDP ratio remains below the regional average, indicating relatively strong fiscal health.
Following the pandemic, Indonesia showed signs of stabilization, with debt slightly decreasing to 39.9% by 2022. The long-term debt reduction strategy, emphasizing economic resilience and prudent fiscal policies, has positioned Indonesia relatively well compared to other emerging economies. Despite the impact of recent global challenges, Indonesia's debt-to-GDP ratio remains below the regional average, indicating relatively strong fiscal health.
Explore related charts to gain a better understanding of Indonesia’s net lending/borrowing as a percentage of GDP, Indonesia’s annual GDP growth rate, Indonesia’s military personnel rate.