Ireland’s fertility rate fluctuated around 2.0 for much of the 1990s and 2000s, reflecting its traditionally high birth rates in Europe. However, the rate steadily declined to 1.7 by 2022. Socio-economic changes, including women’s increased workforce participation and delayed family formation, played a key role.
The brief rise around 2008 coincided with economic optimism during Ireland's "Celtic Tiger" years, before the financial crisis subdued growth. By 2020, the rate dropped to 1.6, indicative of broader European fertility patterns.
The brief rise around 2008 coincided with economic optimism during Ireland's "Celtic Tiger" years, before the financial crisis subdued growth. By 2020, the rate dropped to 1.6, indicative of broader European fertility patterns.
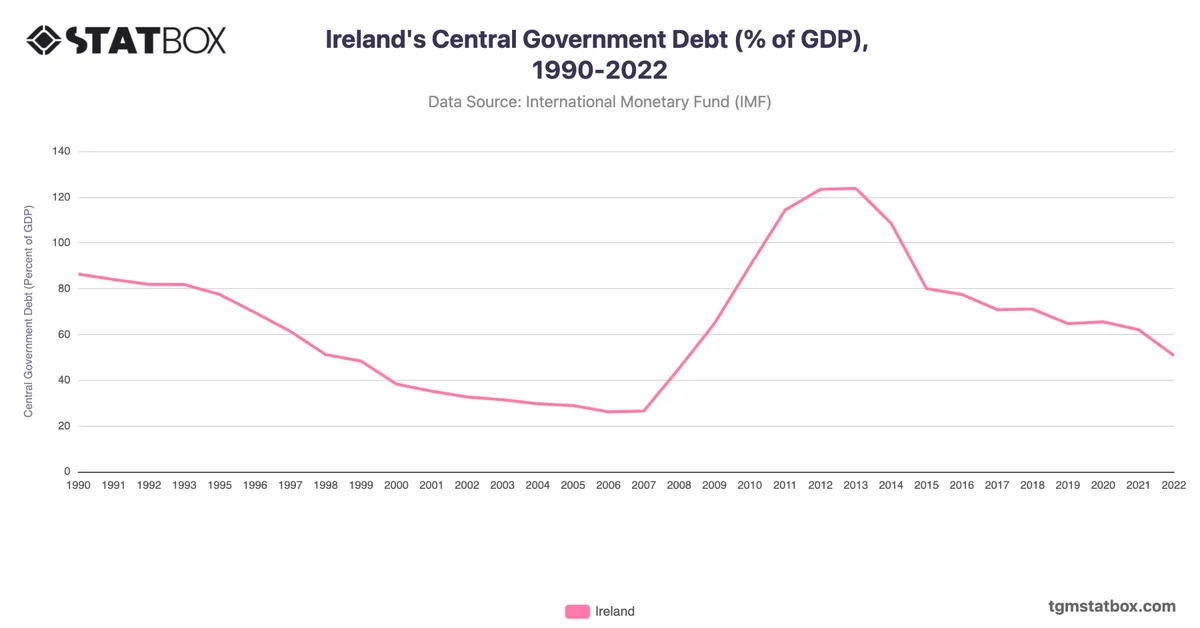
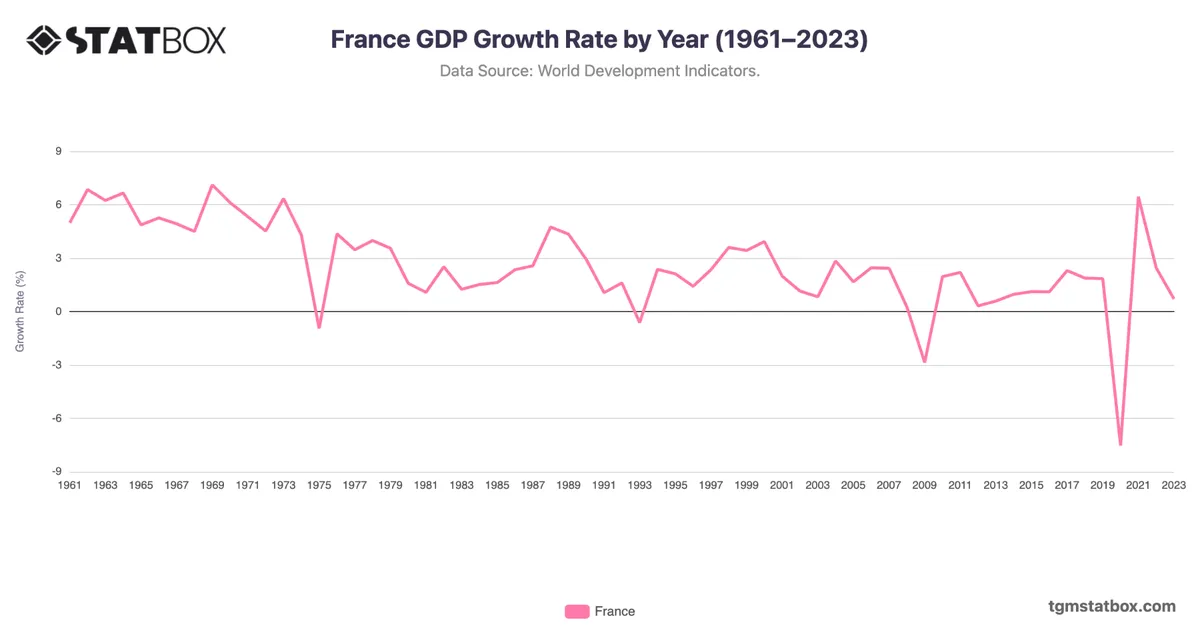
Explore related charts to gain a better understanding of Ireland’s government debt-to-GDP ratio, Ireland’s share of military personnel, Ireland’s annual GDP growth rate.