From 1987 to 2016, Ireland’s military personnel as a percentage of the population demonstrated a gradual decline, starting at 0.4% in 1987 and maintaining this level until 1994. In 1995, it rose slightly to 0.5%, coinciding with a period when Ireland was enhancing its peacekeeping commitments under the United Nations. However, from 2000 onwards, the percentage gradually decreased, settling at 0.2% from 2003 onward. This reduction aligns with the period of economic expansion during the Celtic Tiger years, which saw increased urbanization and an emphasis on civil infrastructure over defense. This long-term stabilization at lower percentages reflects Ireland’s focus on neutrality and limited defense requirements relative to its European counterparts.
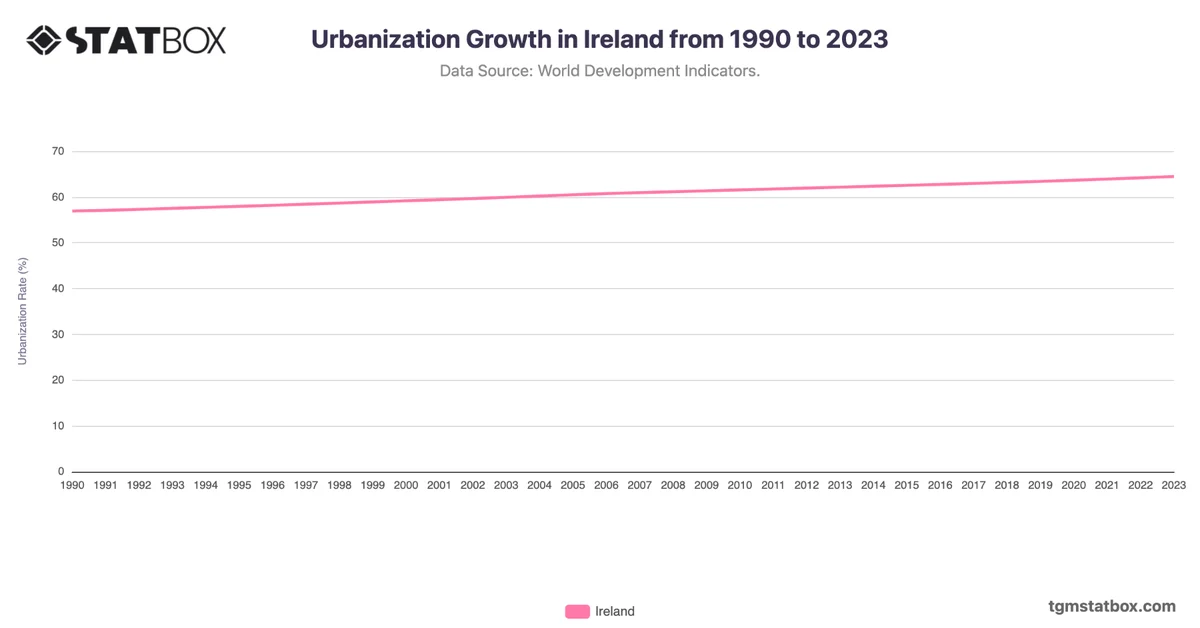
The urban population in Ireland grew steadily over this period, which may have indirectly influenced defense priorities. As cities expanded and resources were directed towards urban development and economic reforms, the country continued its neutral stance in foreign policy, maintaining a minimal military force primarily for peacekeeping. This trend reflects Ireland’s policy to invest in civilian sectors, as urban growth accelerated and the country’s need for a large military force remained low.
The urban population in Ireland grew steadily over this period, which may have indirectly influenced defense priorities. As cities expanded and resources were directed towards urban development and economic reforms, the country continued its neutral stance in foreign policy, maintaining a minimal military force primarily for peacekeeping. This trend reflects Ireland’s policy to invest in civilian sectors, as urban growth accelerated and the country’s need for a large military force remained low.
For additional information, visit statistics on Ireland’s population growth trends, urbanization rise in Ireland, Ireland’s agriculture sector share in GDP.