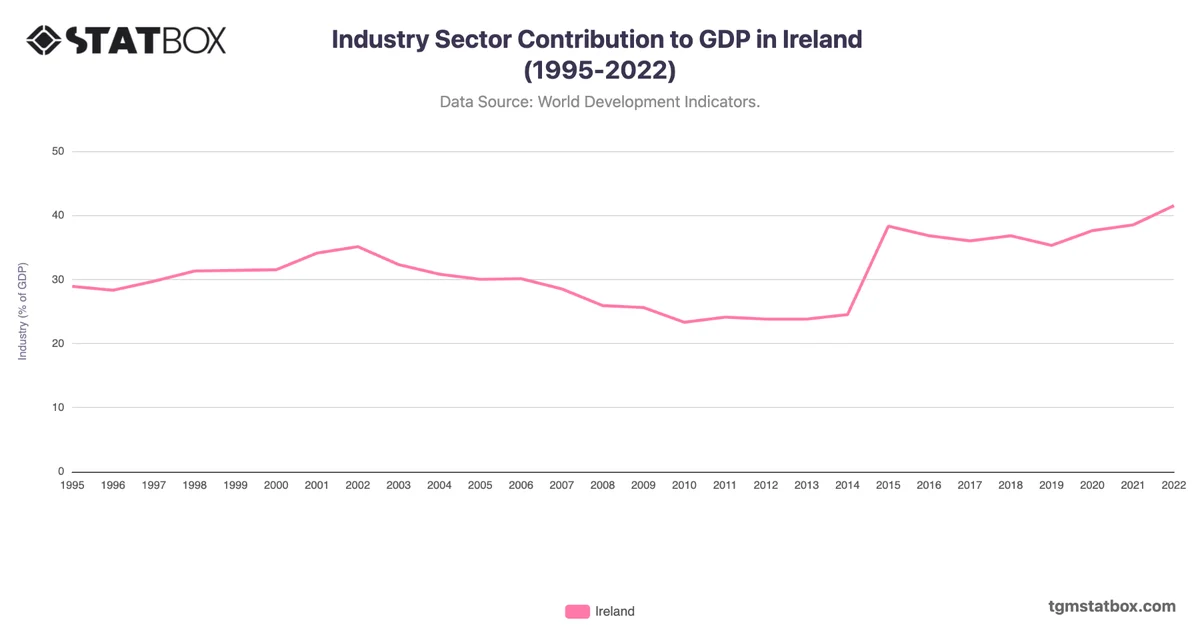
Ireland's unemployment rate showcases dramatic shifts over three decades, reflecting its transformation from an economy facing significant challenges in the early 1990s to a modern, globally integrated one. In 1990, unemployment stood at 14.1% and climbed further to a peak of 15.8% in 1991, as the country struggled with a sluggish economy and high emigration rates. The mid-1990s marked the beginning of Ireland's "Celtic Tiger" era, driven by foreign direct investment and a rapidly expanding tech sector, which brought unemployment down to 3.7% by 2001.
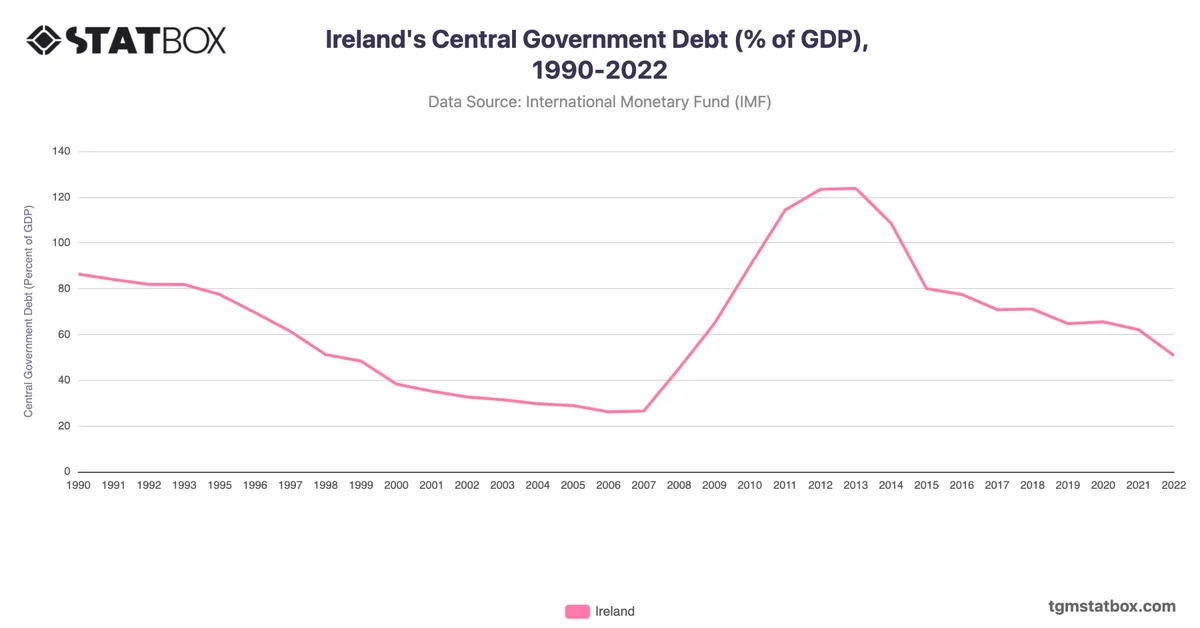
The global financial crisis of 2008 hit Ireland particularly hard due to its overreliance on the construction sector and a banking collapse. Unemployment surged to 15.4% by 2011, highlighting the severe economic fallout. Recovery efforts, including austerity measures and support from the EU-IMF bailout program, helped stabilize the economy, with unemployment gradually declining to 5% by 2019.
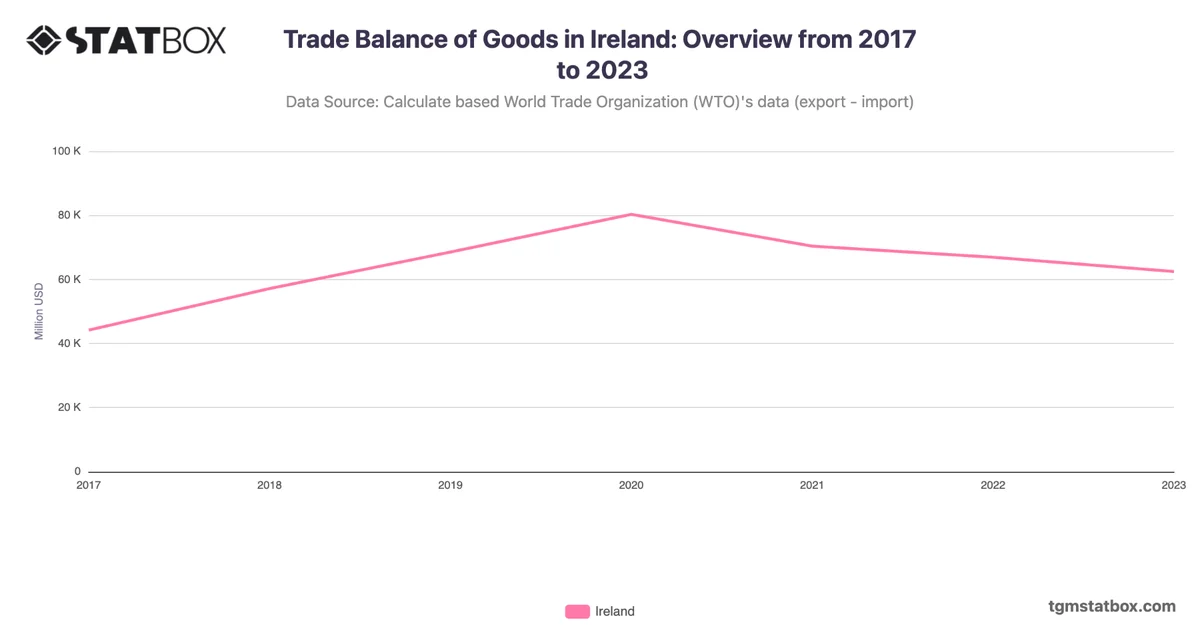
The COVID-19 pandemic caused a temporary increase to 6.2% in 2021, but Ireland's economy rebounded quickly, supported by strong exports and a robust tech sector, returning unemployment to pre-pandemic levels by the early 2020s.
The global financial crisis of 2008 hit Ireland particularly hard due to its overreliance on the construction sector and a banking collapse. Unemployment surged to 15.4% by 2011, highlighting the severe economic fallout. Recovery efforts, including austerity measures and support from the EU-IMF bailout program, helped stabilize the economy, with unemployment gradually declining to 5% by 2019.
The COVID-19 pandemic caused a temporary increase to 6.2% in 2021, but Ireland's economy rebounded quickly, supported by strong exports and a robust tech sector, returning unemployment to pre-pandemic levels by the early 2020s.
Gain a broader perspective by reviewing Ireland’s population data, Ireland’s agriculture sector share in GDP, Ireland’s annual GDP data.