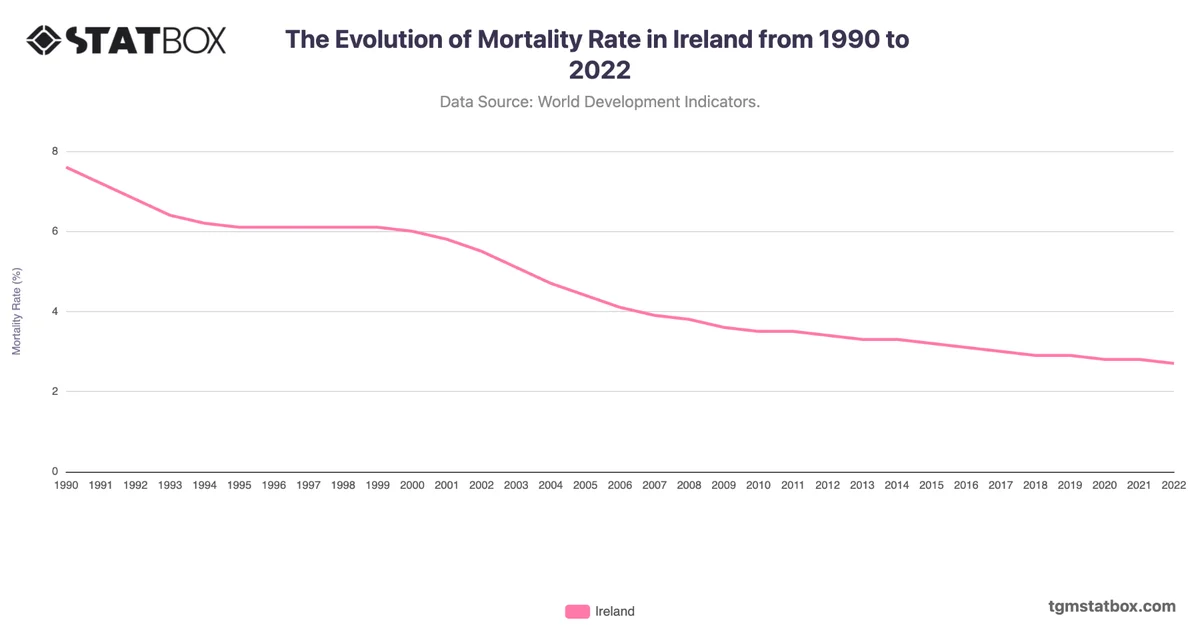
Ireland's death rate steadily declined from 8.9 in 1990 to 6.1 in 2010, reflecting advances in healthcare, rising living standards, and reduced infant mortality. Stabilization around 6.3 through the 2010s indicates consistent health outcomes and effective healthcare delivery.
A slight rise to 6.8 in 2021 and 6.9 in 2022 aligns with the COVID-19 pandemic's effects, though Ireland's rate remained relatively low compared to other European nations. This resilience highlights effective public health measures and vaccination campaigns.
A slight rise to 6.8 in 2021 and 6.9 in 2022 aligns with the COVID-19 pandemic's effects, though Ireland's rate remained relatively low compared to other European nations. This resilience highlights effective public health measures and vaccination campaigns.
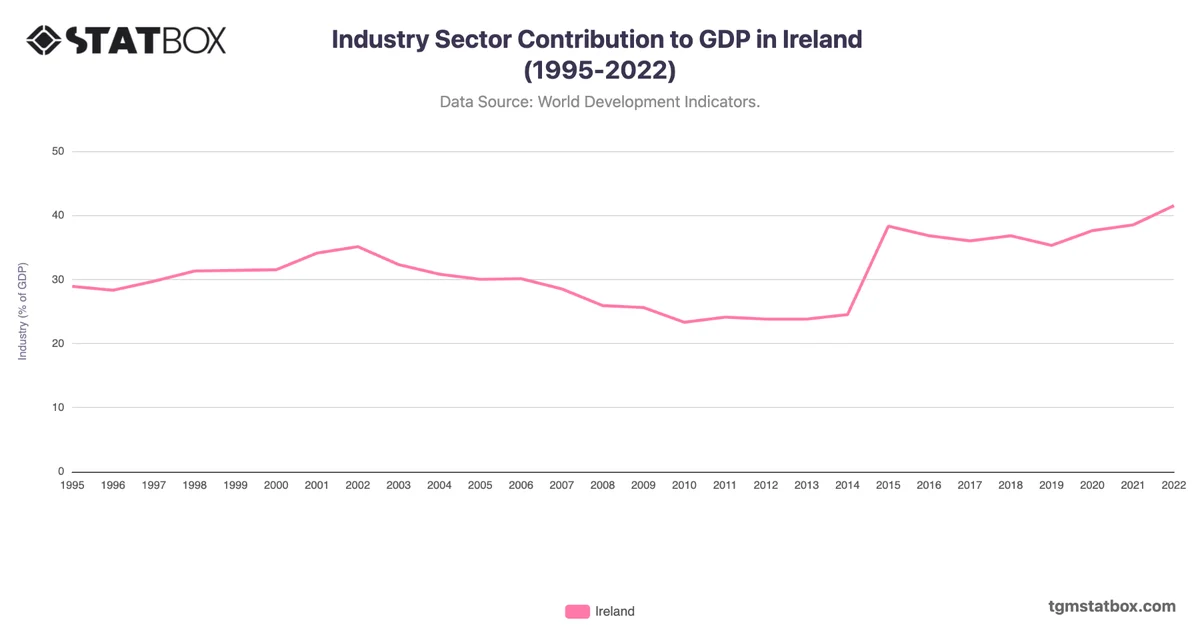
For a deeper dive into the topic, explore Ireland’s fertility rate trends, Ireland’s military personnel data, Ireland’s industry sector share in GDP.