The chart highlights the trends in Ghana’s working-age population (ages 15 to 64) from 1990 to 2022. In 1990, 50.6% of the population fell within the working-age group, steadily rising to 59.5% by 2022.
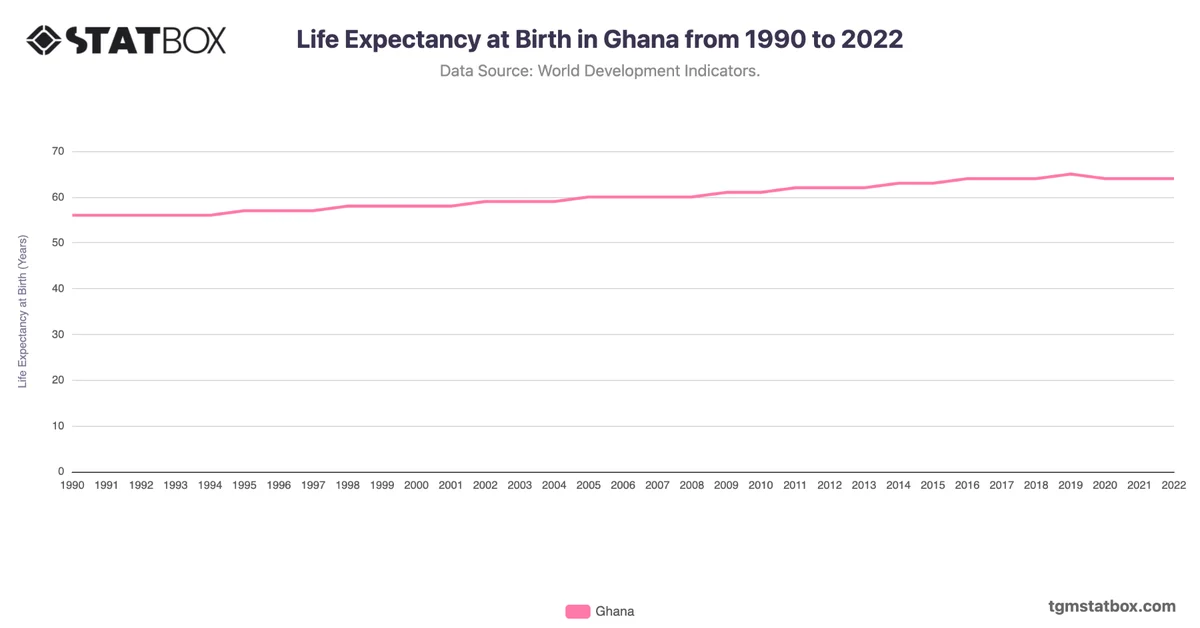
This consistent growth reflects Ghana’s broader demographic shifts, characterized by improving healthcare and life expectancy, alongside declining birth rates. The steady rise in the working-age population over the years points to a demographic transition, where a larger proportion of the population becomes economically active, potentially driving productivity and supporting long-term growth trends.
This consistent growth reflects Ghana’s broader demographic shifts, characterized by improving healthcare and life expectancy, alongside declining birth rates. The steady rise in the working-age population over the years points to a demographic transition, where a larger proportion of the population becomes economically active, potentially driving productivity and supporting long-term growth trends.
For a broader context, visit other statistics on Ghana’s military personnel history, Ghana’s population numbers, Ghana’s urbanization rate.