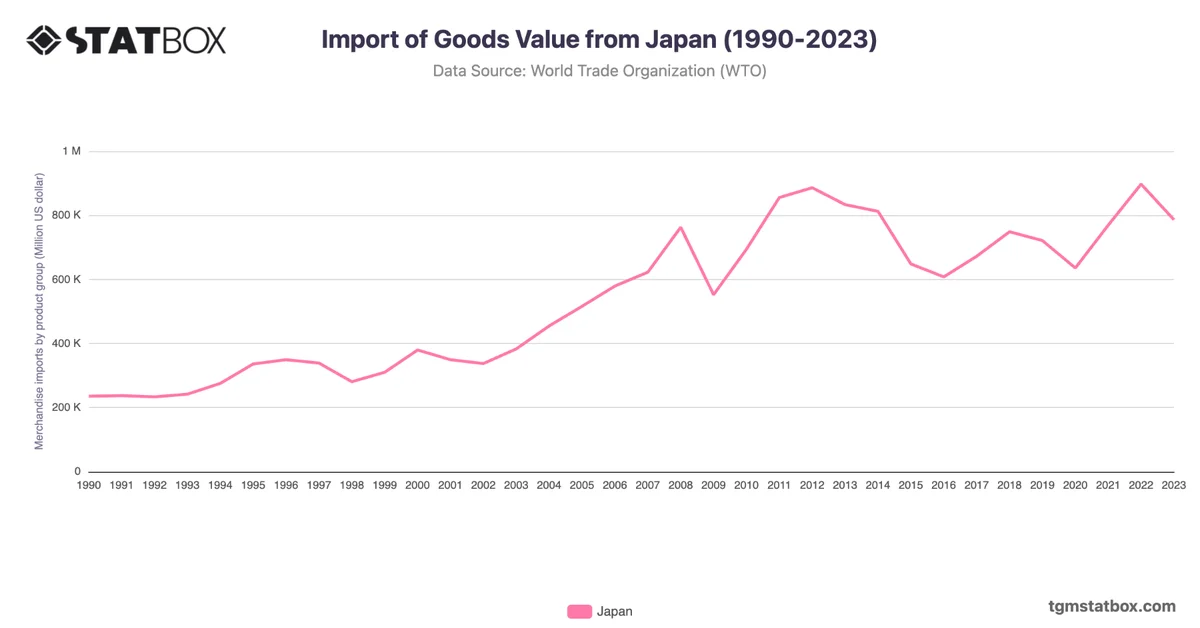
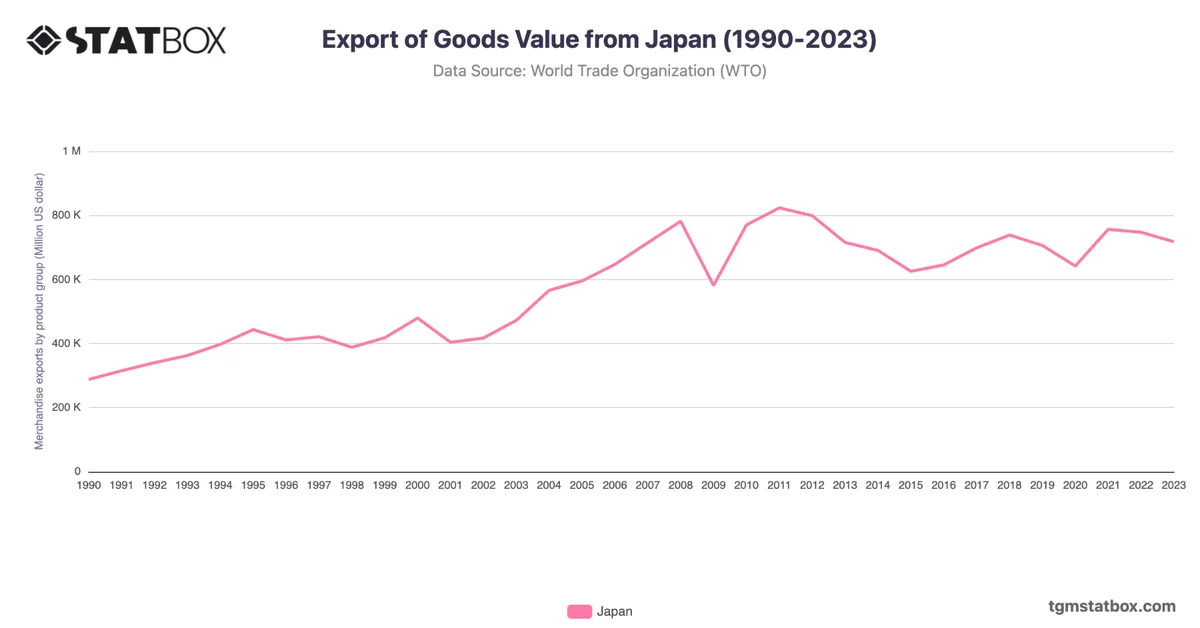
Japan’s trade balance fluctuated significantly, recording a surplus of 26,232.6 million USD in 2017 before transitioning to persistent deficits from 2018 onwards. The deficit peaked at -150,339.9 million USD in 2022, driven by soaring energy import costs and a weakening yen, which increased the cost of imports.
In 2023, the deficit narrowed to -68,299.7 million USD, reflecting declining energy prices and a modest recovery in export sectors such as automobiles and electronics. Japan’s trade performance highlights the challenges of energy dependency and currency volatility while emphasizing the need for export growth and energy transition strategies.
In 2023, the deficit narrowed to -68,299.7 million USD, reflecting declining energy prices and a modest recovery in export sectors such as automobiles and electronics. Japan’s trade performance highlights the challenges of energy dependency and currency volatility while emphasizing the need for export growth and energy transition strategies.
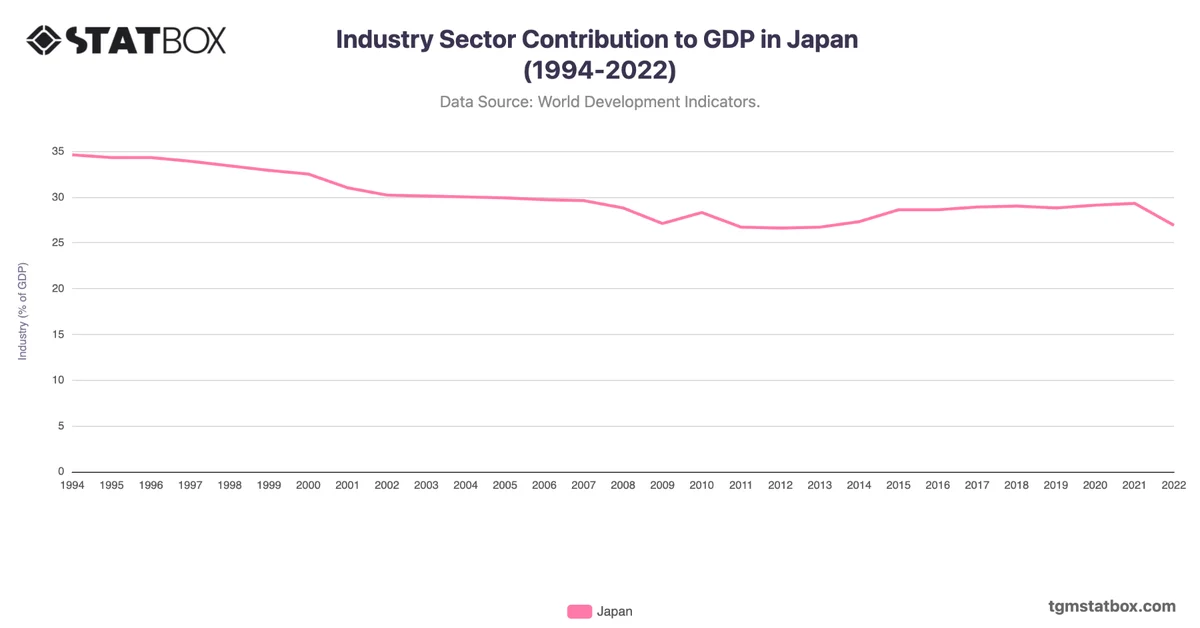
For a deeper dive into the topic, explore Japan’s population data, Japan’s military personnel proportion, Japan’s industry sector GDP share.