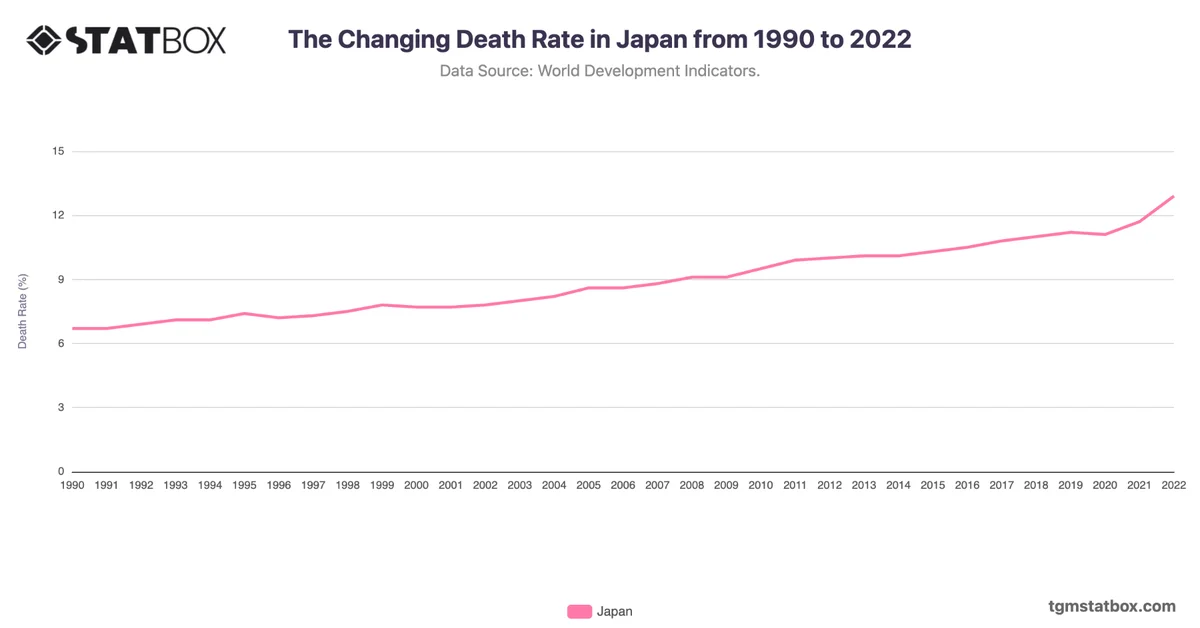
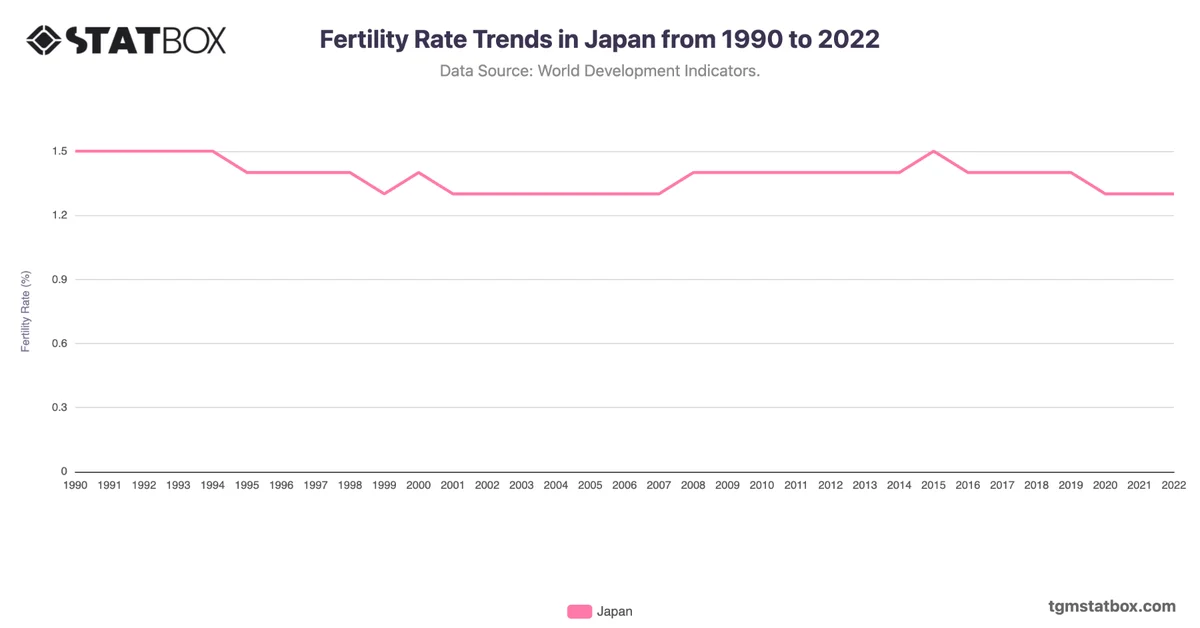
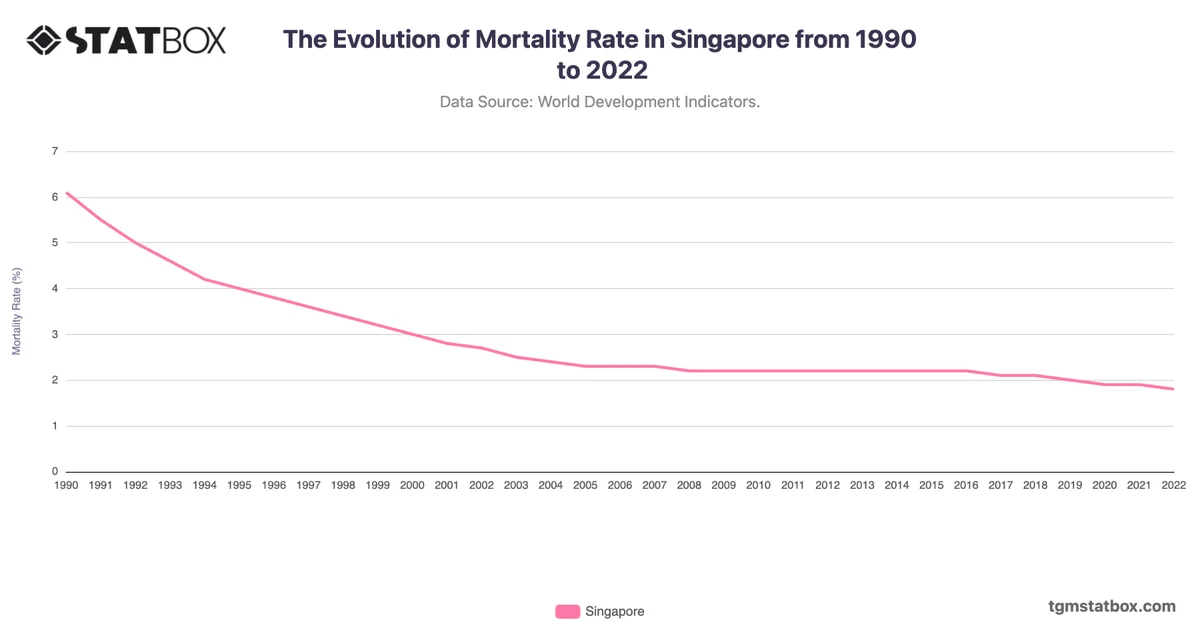
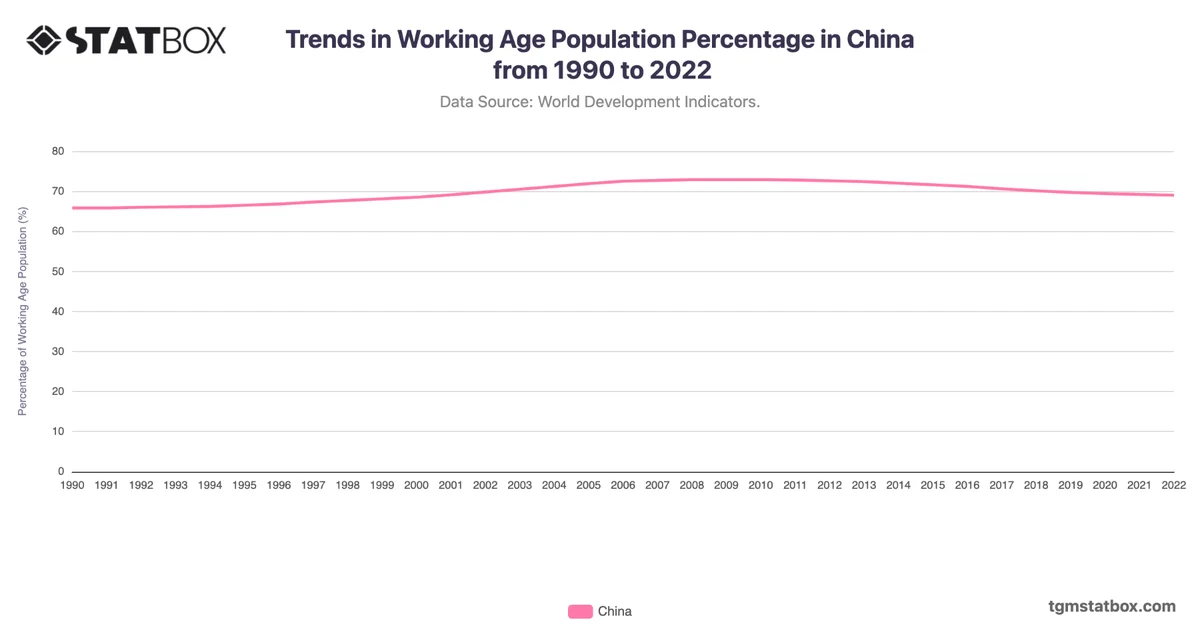
Japan maintained one of the lowest unemployment rates among developed nations, with figures consistently under 5% despite economic challenges. The rate was as low as 2.1% in the early 1990s but climbed to 5.4% by 2002, reflecting the impact of the Lost Decade, where prolonged economic stagnation and deflation took hold. By 2007, Japan's unemployment had improved to 3.9% as the economy adapted with measures to promote corporate restructuring and workforce productivity.
The rate peaked again in 2009 during the global financial crisis, reaching 5.1%, but gradually recovered in the following years. By 2023, it stabilized at 2.6%, showcasing Japan's consistent labor demand amidst a shrinking population, which presents unique challenges in sustaining long-term economic growth without a significant increase in labor force participation.
The rate peaked again in 2009 during the global financial crisis, reaching 5.1%, but gradually recovered in the following years. By 2023, it stabilized at 2.6%, showcasing Japan's consistent labor demand amidst a shrinking population, which presents unique challenges in sustaining long-term economic growth without a significant increase in labor force participation.
Gain a broader perspective by reviewing Japan’s military personnel proportion, Japan’s demographic trends, Japan’s population data.