Japan’s imports have demonstrated a long-term upward trend, growing from $235.4B in 1990 to $897.2B in 2022. The 1990s showed steady growth, with imports peaking at $379.5B in 2000, driven by robust demand for energy and consumer goods. However, the global financial crisis caused a decline to $551.9B in 2009.
The recovery was strong in the following years, with imports reaching $855.4B by 2011, supported by rising energy needs post-Fukushima. A peak in 2022 reflects a surge in global trade and energy imports. The slight decline to $785.8B in 2023 suggests stabilization amid changing global economic conditions.
The recovery was strong in the following years, with imports reaching $855.4B by 2011, supported by rising energy needs post-Fukushima. A peak in 2022 reflects a surge in global trade and energy imports. The slight decline to $785.8B in 2023 suggests stabilization amid changing global economic conditions.
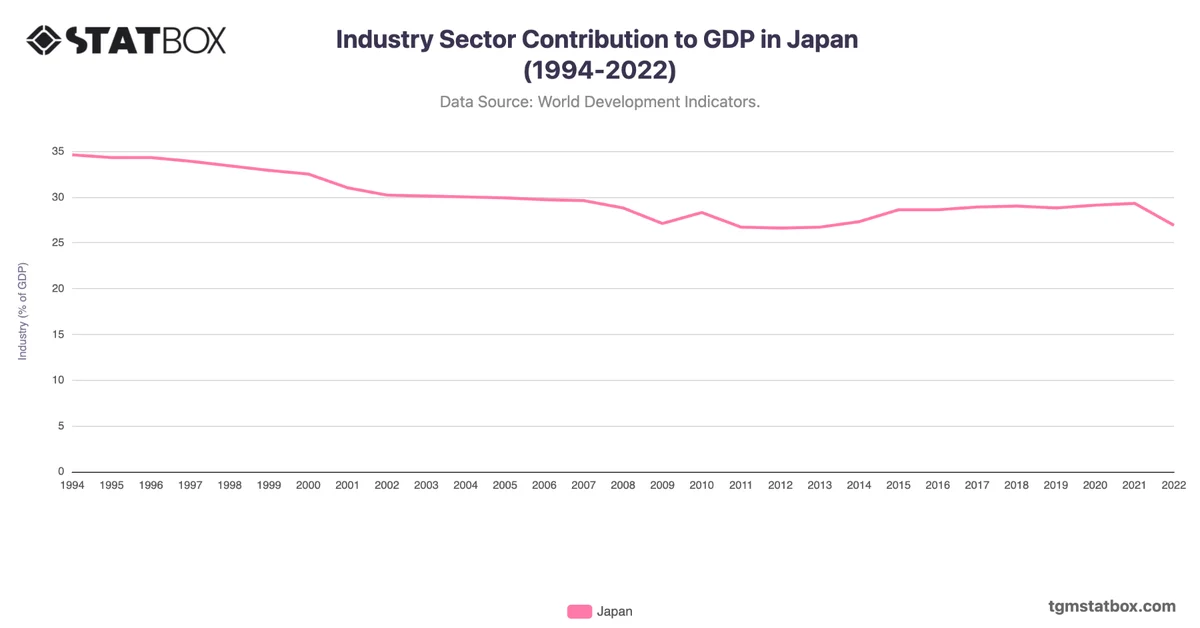
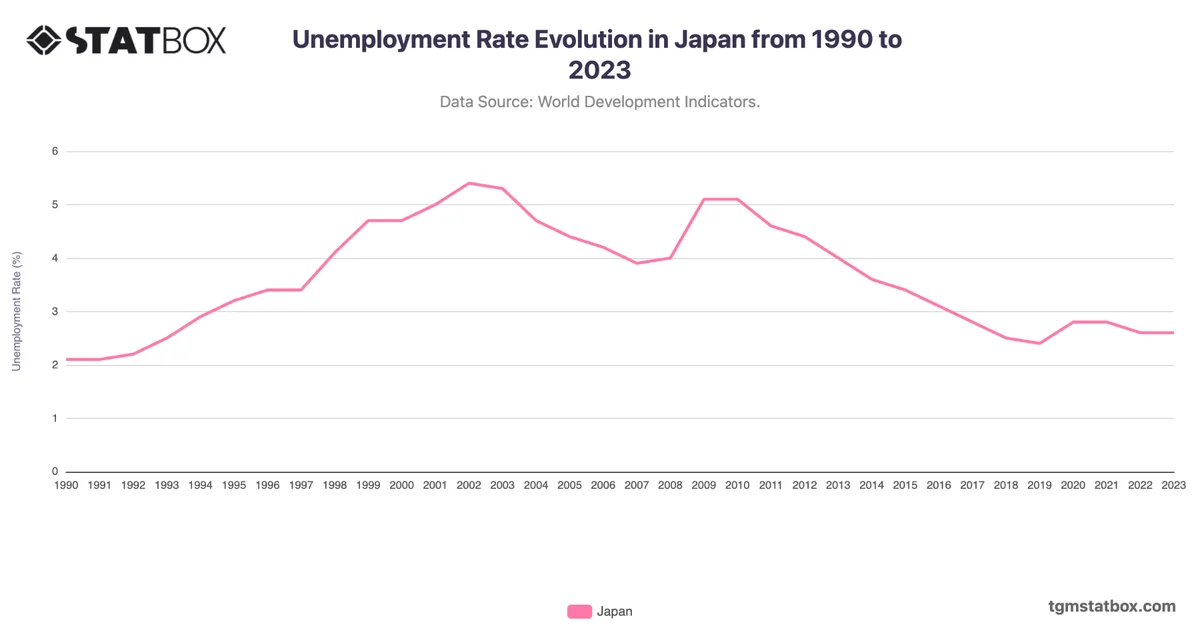
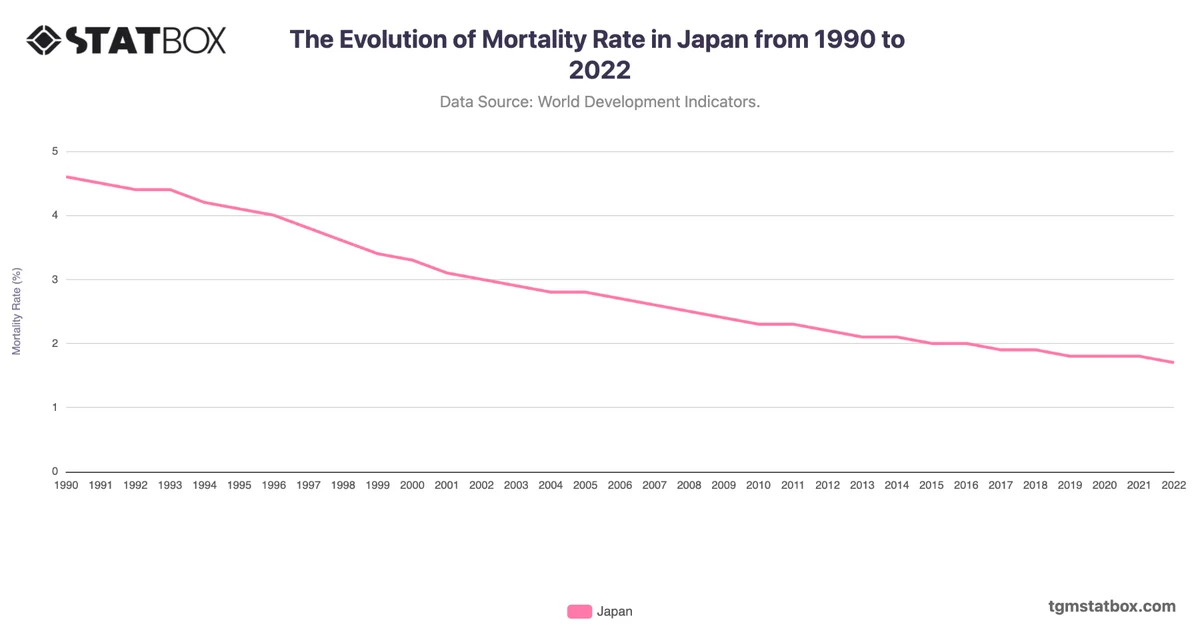
Discover additional trends and data on Japan’s unemployment rate, Japan’s industry sector GDP share, Japan’s mortality rate.