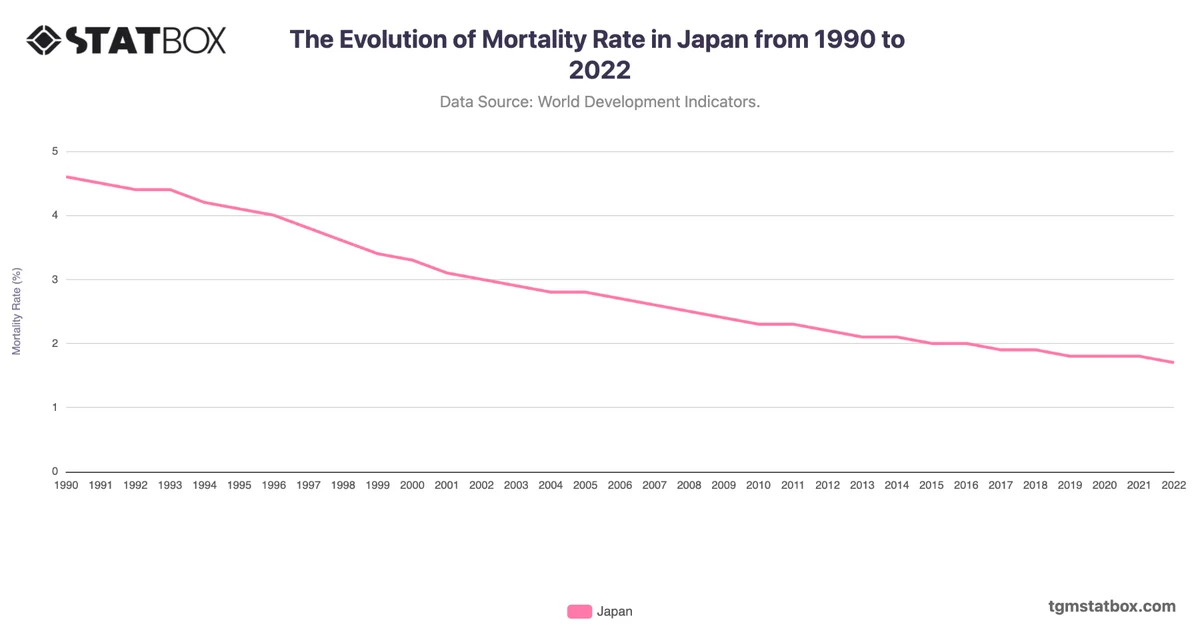
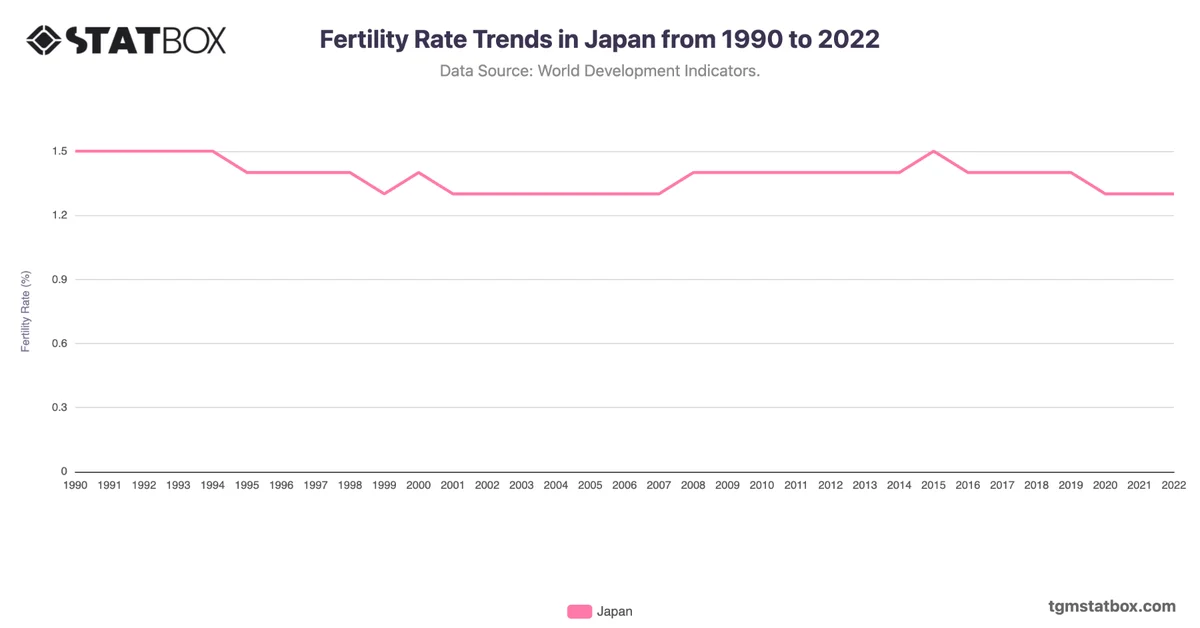
Japan's death rate rose steadily from 6.7 in 1990 to 12.9 in 2022. This increase is primarily linked to its aging population, a key demographic trend in Japan. By the 2000s, Japan had one of the highest life expectancies globally, resulting in an aging society where deaths naturally outpace births. Notable increments occurred after 2005, as the population aged further, and health conditions related to old age, such as heart disease and cancer, became more prevalent.
The significant increase to 11.7 in 2021 reflects the impact of the COVID-19 pandemic, which particularly affected elderly populations. However, Japan's healthcare system helped mitigate further spikes. The consistent upward trend emphasizes the challenges Japan faces in balancing healthcare costs and supporting its aging society.
The significant increase to 11.7 in 2021 reflects the impact of the COVID-19 pandemic, which particularly affected elderly populations. However, Japan's healthcare system helped mitigate further spikes. The consistent upward trend emphasizes the challenges Japan faces in balancing healthcare costs and supporting its aging society.
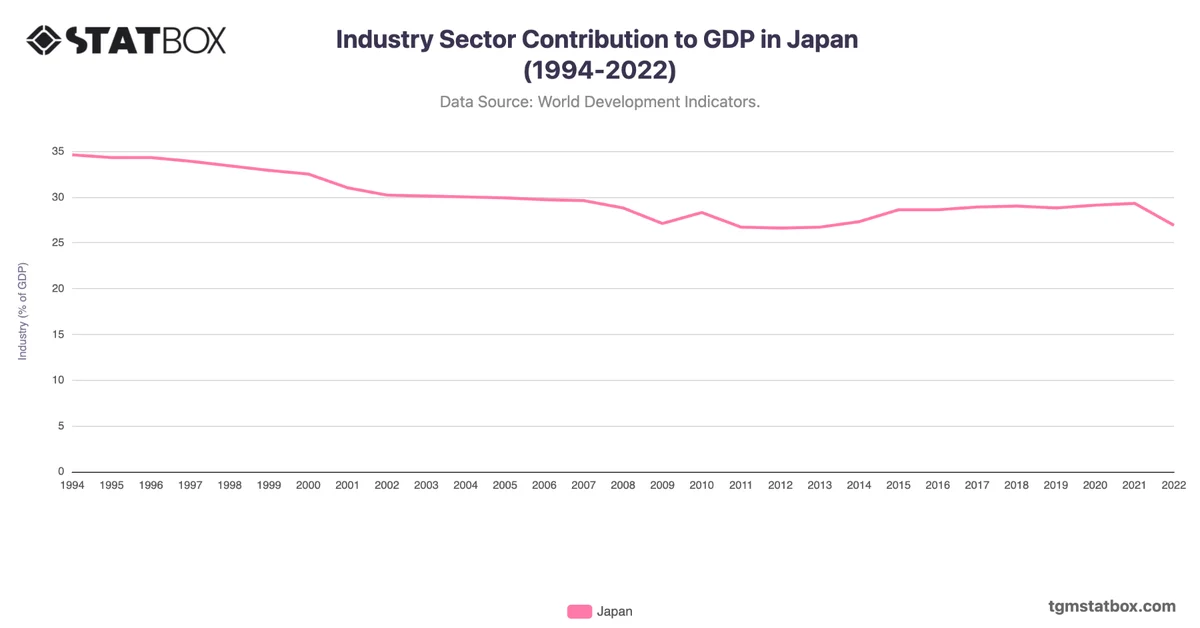
Discover additional trends and data on Japan’s industry sector GDP share, Japan’s population density estimate, shifting median age in Japan.